Where the Problem Started
Monitoring is not something to attach after a service breaks. As a system grows, the ability to collect metrics, read them in a consistent place, and notice abnormal behavior becomes part of the product’s reliability. This post records the smallest useful observability loop I built with Spring Boot, Prometheus, and Grafana.
I introduced Prometheus and Grafana for project monitoring.
They are open-source tools often used together, each playing a different role, and there is also an option called Thanos, which does more than Prometheus.
Prometheus collects metrics by scraping targets, and it represents those metrics with names and label dimensions. In a Spring Boot application, actuator settings can expose the required endpoints without manually wiring every metric. Besides HTTP request metrics, Prometheus can also collect CPU, memory, disk, and other runtime signals. A minimal configuration looks like this.
Implementation Path
implementation 'org.springframework.boot:spring-boot-starter-actuator'
implementation 'io.micrometer:micrometer-registry-prometheus'
Add this to build.gradle.
management.endpoints.web.exposure.include=prometheusAdd this to application.yaml.
After installing Prometheus, configure the prometheus.yaml file.
global:
  scrape_interval: 15s

scrape_configs:
  - job_name: 'spring-actuator'
    metrics_path: '/actuator/prometheus'
    static_configs:
    - targets: ['localhost:8080']
The targets section specifies the host and port where the current application is running, and metrics are collected from there.
./prometheus --config.file=prometheus.ymlRun it simply with the config file.
How I Verified It
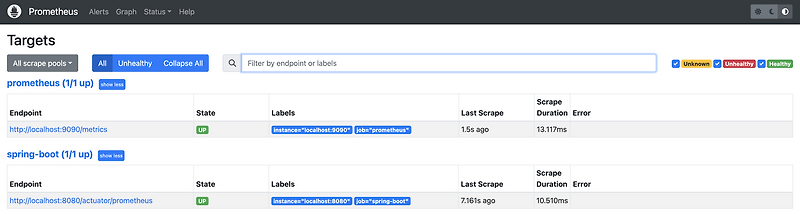
If the configuration is correct, the Prometheus UI opens on the default port, 9090. The target status page should show the Spring Boot application as an active scrape target.
Prometheus only collects metrics, so it is inconvenient to visualize and inspect metrics directly in Prometheus. You can still view metrics by querying Expressions. This works through a query language called PromQL.
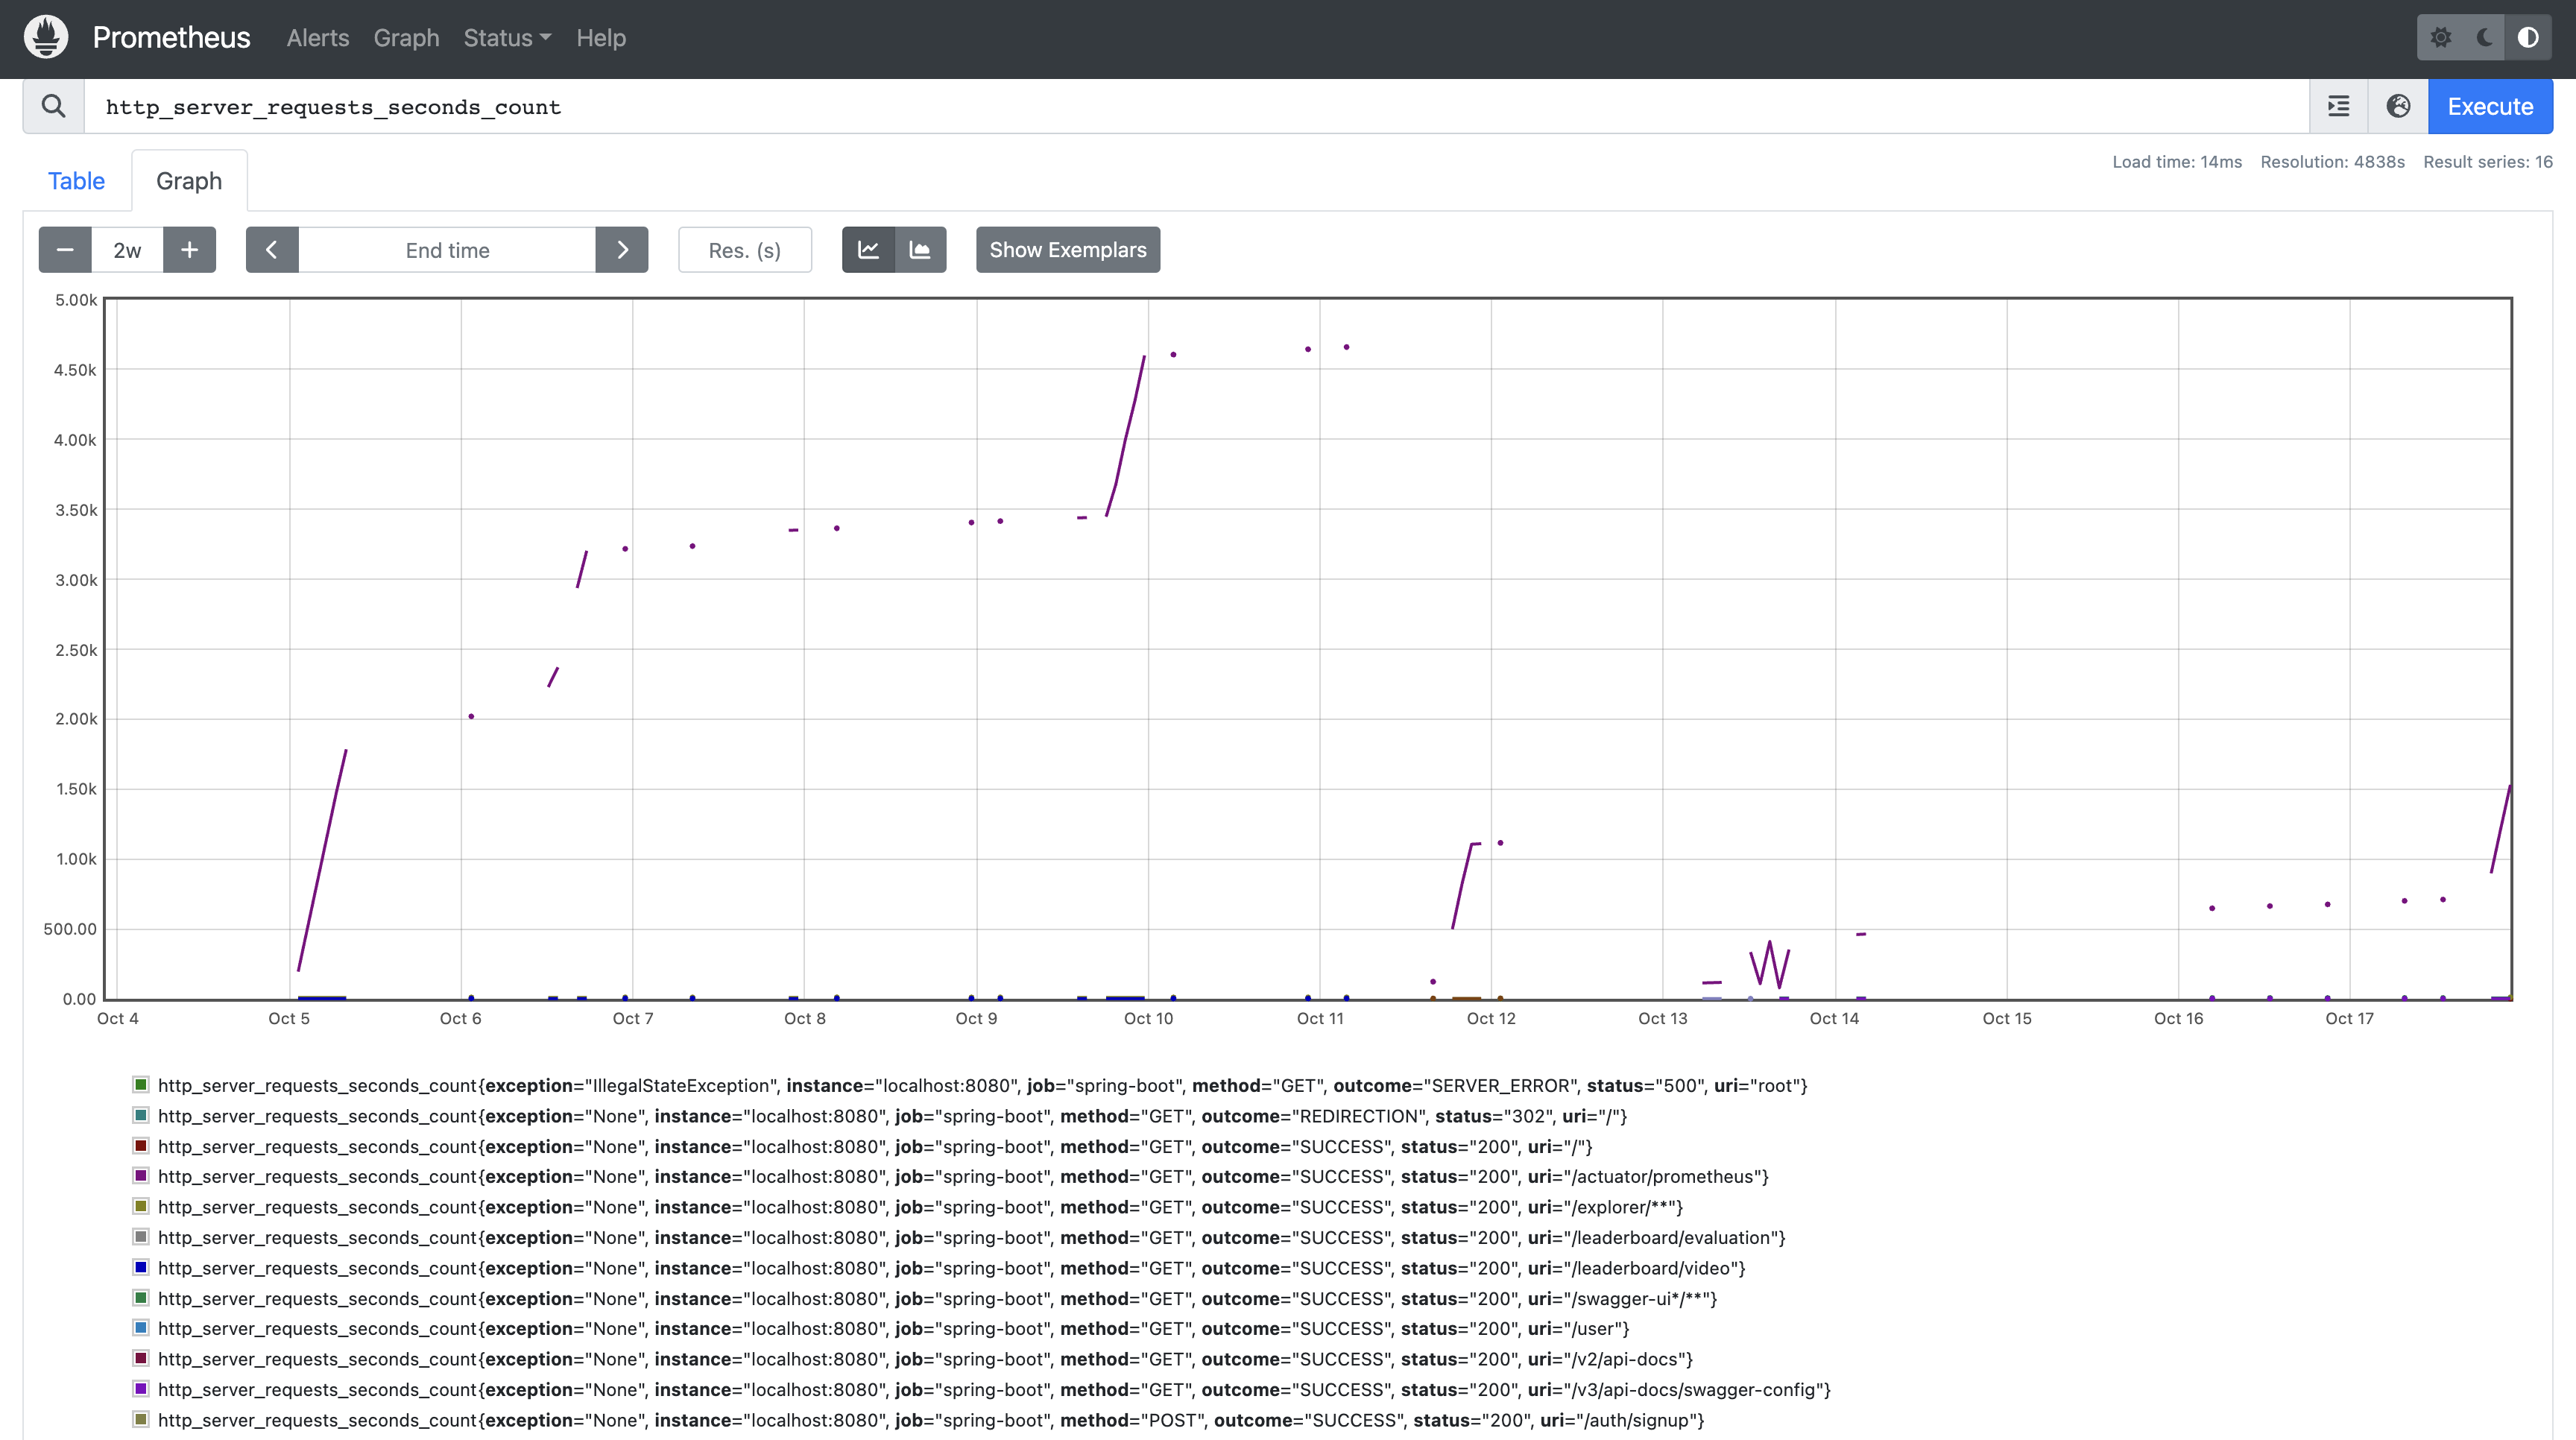
Running a query such as http_server_requests_seconds_count produces a basic graph immediately.
Prometheus can provide visualization like this, but there are many advantages to using a separate visualization tool called Grafana.
Grafana adds the layer Prometheus alone does not provide well: refined dashboards, multi-environment views, annotations, alerting, and a much better surface for repeatedly reading operational state.
Grafana setup is simple.
systemctl start grafana-serverAfter installing Grafana, you just need to run it.
It runs on the default port, 3000, and the default credentials on first login are admin/admin.
Go to Configurations -> Data Sources, select Prometheus, and set the HTTP URL. If you followed the previous setup, it would be http://localhost:9090. Then you can browse the metrics brought in from Prometheus.
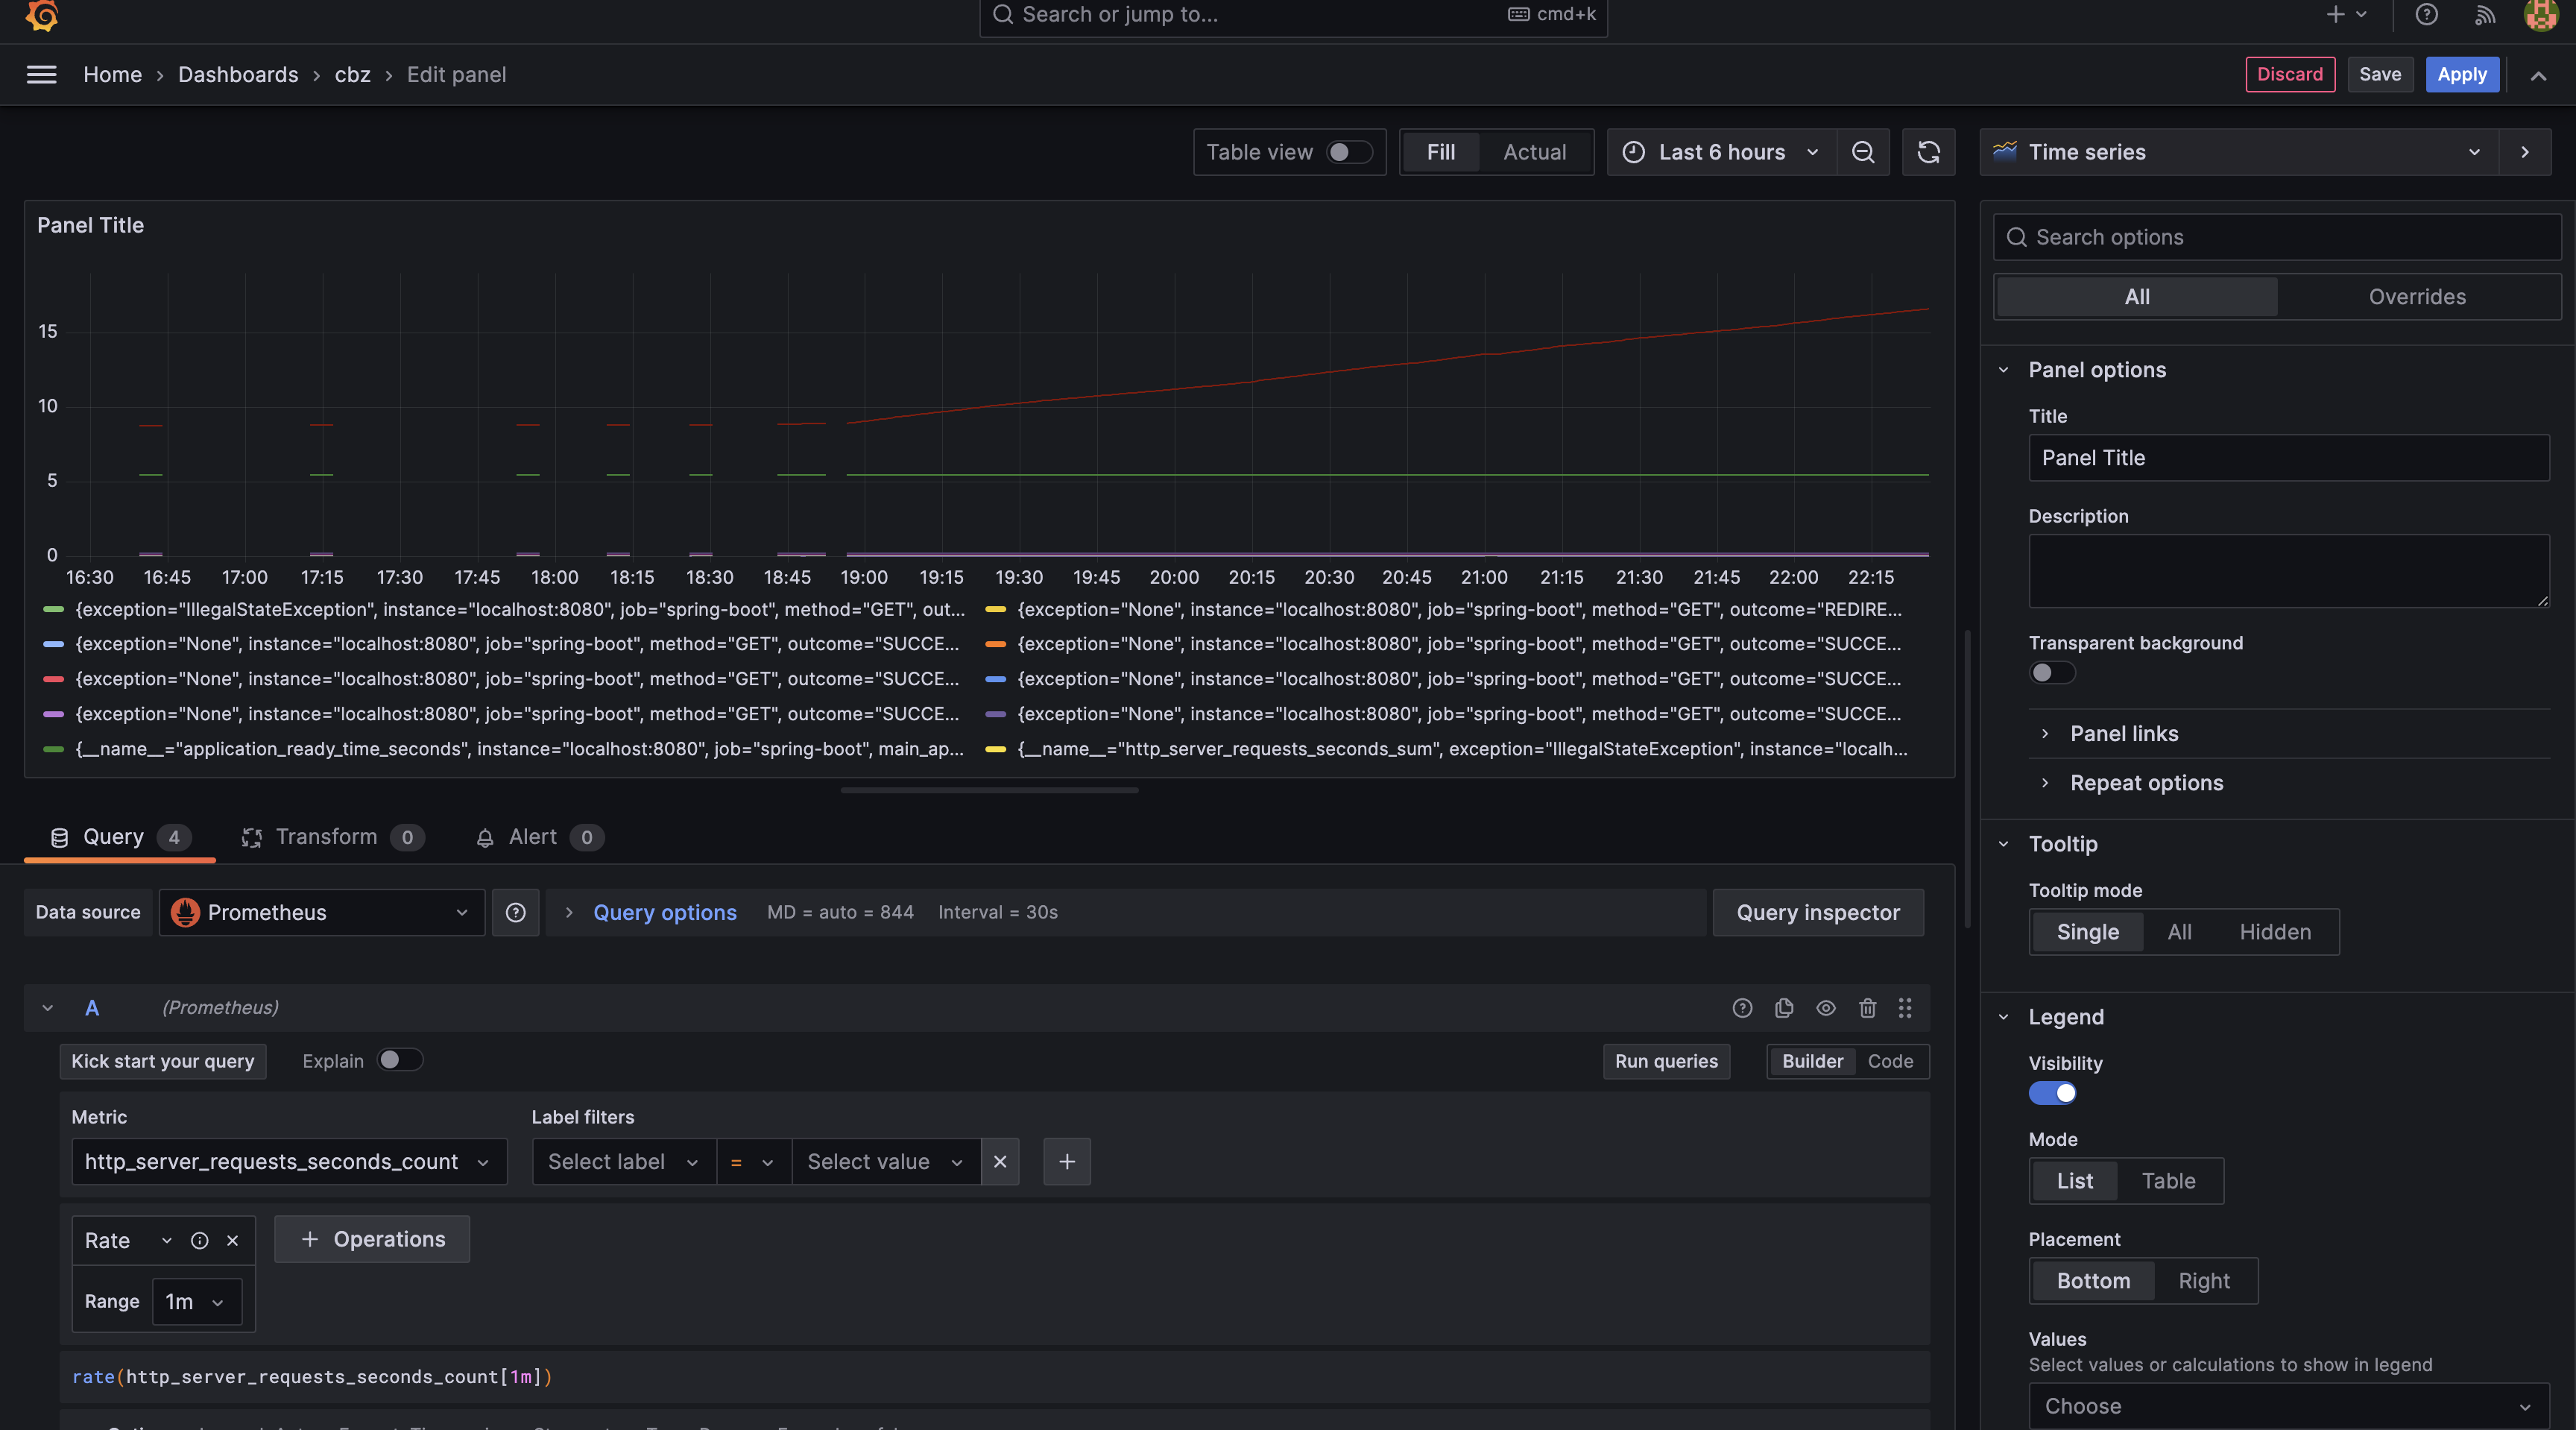
From there, create a dashboard and use Add Query to put multiple metrics into the dashboard.
Operational Notes
The setup itself is not difficult. The more important point is that exposing actuator metrics and opening a dashboard starts the habit of reading service state through numbers. Once custom metrics and alerts are added, this small configuration becomes a real basis for operational decisions.
The query types provided by Prometheus & Grafana are limited, but if there are metrics you want, you can easily expose them by writing custom queries in Spring Boot.
After local testing, the setup process is the same in an EC2 production environment. You only need to open ports 3000 and 9090.