On this page
The failures that do not look like failures
Some of the most expensive database bugs do not begin with an error. Both requests return successfully. Both transactions commit. The logs contain no stack trace. The API emits two 200 responses, but one business operation quietly disappears.
That class of failure bothered me more than an ordinary syntax or constraint error. A broken query that raises immediately is unpleasant, but it is visible. A lost update, write skew, double-claimed job, missing outbox event, or badly chosen index can survive code review and remain invisible until concurrency or traffic gives it the exact conditions it needs. By the time the symptom reaches an operator, the transaction boundary that caused it is gone.
I had encountered the ingredients many times in backend work: transaction annotations that looked correct from the application side, lock waits that only made sense after inspecting PostgreSQL, retries that accidentally repeated a side effect, indexes that improved one read while making every write more expensive, and monitoring graphs whose numbers could be read three different ways. The recurring problem was not a lack of definitions. I knew what READ COMMITTED, SERIALIZABLE, SELECT FOR UPDATE, SKIP LOCKED, partial indexes, and the transactional outbox were. The problem was that definitions are much easier to remember than behavior is to prove.
PostgreSQL Consistency Lab began as an attempt to close that gap.
The first repository description was deliberately narrow: a transaction, lock, and index failure simulator. Its original definition of done for each scenario already contained the important constraints:
- start from a production-shaped story;
- reproduce the failure deterministically;
- implement and run a correct alternative;
- measure the result instead of relying on intuition;
- preserve lock, SQLSTATE, or query-plan evidence where it matters;
- explain when the fix is appropriate and what it costs.
The earliest scaffold framed this partly as backend engineering practice. That was useful for choosing the first scenarios, but it became too small a description of the finished system. I did not want another repository that listed concurrency anomalies in Markdown or showed a polished UI over fixture data. I wanted one local environment where I could create a real PostgreSQL failure, stop at the interesting moment, inspect the database, compare strategies, replay the evidence, and then prove that the lab cleaned up only what it owned.
That requirement changed the project from a scenario runner into a database engineering workbench.
The first architecture was intentionally disposable
The repository was created on July 9, 2026 as a docs-first Kotlin and Gradle scaffold. The initial architecture was small:
CLI
 └── ScenarioRunner
      ├── ScenarioCatalog
      ├── DatabaseFixture
      ├── ConcurrentActors
      ├── ProbeCollectors
      └── ReportWriter
It was a reasonable starting point. PostgreSQL would run in Docker Compose. Each scenario would own a fixture. Concurrent actors would meet at explicit barriers. Probe collectors would retain outcomes, final state, latency, locks, plans, and SQLSTATEs. A Markdown-first report writer would make the evidence portable.
The first ADR selected Kotlin because it was familiar for backend work and expressive enough for the initial harness. Before scenario implementation began, however, the target changed. I wanted a custom dashboard and a local MCP server in addition to the CLI. Long-lived transactions needed to remain attached to real database connections. Workloads needed visible worker and pool state. The MCP adapter needed structured objects rather than console parsing. A single runtime would have to serve several transports without letting each transport invent its own database behavior.
At that point I replaced the Kotlin anchor with Go 1.25 and pgx.
The language change was not about claiming that Go was universally better. It was about making the concurrency model of this particular tool obvious. Goroutines and channels were a compact fit for two database actors meeting at a barrier. pgx exposed PostgreSQL transactions, SQLSTATEs, pools, and extended-protocol execution directly. The official Go MCP SDK could be added later without creating another runtime. Rust would have offered stronger compile-time ownership, but it also would have put more language machinery between the reader and the transaction schedule I wanted the project to explain.
The second ADR therefore established a more durable dependency direction:
CLI / HTTP / MCP
       │
       ▼
shared Go application services
       │
       ▼
pgx / PostgreSQL 16
MCP would be an adapter. HTTP would be an adapter. The CLI would be an adapter. None of them would shell out to another interface or parse human-readable output. This decision looks ordinary in the final repository, but it prevented a great deal of later drift. When emergency stop, sandbox validation, actor ownership, or scenario evidence changed, there was one implementation to update.
The smallest experiment: losing one of two committed updates
The first executable scenario was tx-lost-update. I chose it because it captures the reason the lab exists: a correctness failure can occur even though both transactions commit.
The fixture starts with one account:
create table consistency_lab.accounts (
    id bigint primary key,
    balance bigint not null,
    version bigint not null default 0
);

insert into consistency_lab.accounts (id, balance)
values (1, 100);
Two actors each add 10. The broken implementation reads the balance in application code and later writes the calculated value. Under READ COMMITTED, both actors can read 100, both calculate 110, and both commit an update to 110. The database did exactly what it was asked to do. The business invariant did not survive.
Coordinator        Actor A                 Actor B
    |                  |                       |
    |              BEGIN RC                BEGIN RC
    |              SELECT 100              SELECT 100
    |<------------- both actors ready ----------------->|
    |------------- release update barrier -------------->|
    |              UPDATE 110              UPDATE 110 waits
    |              COMMIT                  lock acquired
    |                                      UPDATE 110
    |                                      COMMIT
    |---------------- final balance: 110 ---------------->|
The important part is the barrier. A test based on sleep(100 * time.Millisecond) might fail on one machine and pass on another. It would demonstrate scheduler luck, not a transaction anomaly. The coordinator releases the updates only after both transactions have recorded the stale read. The final balance of 110 is therefore the expected broken outcome, not a flaky surprise.
The first fix used an atomic update:
update consistency_lab.accounts
set balance = balance + $1
where id = 1;
PostgreSQL serializes the row updates, and the expression is evaluated against the current row version. Both commits are represented, so the final balance becomes 120.
The completed scenario later grew to five strategies:
| Strategy | Mechanism | Result and cost to expose |
|---|---|---|
broken | application read-modify-write | both commits can produce 110/120 |
atomic | one in-database update expression | preserves the increment with row serialization |
optimistic_version | version predicate and conflict detection | preserves correctness by surfacing a conflict |
select_for_update | pessimistic row lock before calculation | preserves correctness while making waiting explicit |
serializable_retry | serializable transaction plus bounded retry | preserves the invariant and may expose SQLSTATE 40001 |
This set became the pattern for the rest of the catalog. The lab does not label a strategy “fixed” merely because the final value is correct. It also records the mechanism that made it correct: wait, conflict, retry, constraint, plan change, additional index size, or extra ledger write. A repair without its cost is only half an explanation.
Moving from one fixture to marked sandboxes
The original lost-update runner used a shared schema and an advisory lock to prevent two executions from resetting the fixture simultaneously. That was adequate for one bounded CLI scenario. It was not enough for a dashboard that could create schemas, open long transactions, run workloads, build indexes, and accept commands from MCP.
The next vertical slice introduced an explicit PostgreSQL ownership boundary.
Every writable database must contain a lab marker. If the marker is missing or its environment is not lab, mutation is refused. The marker is intentionally simple, because its job is not to provide authentication. Its job is to make an accidental connection to an ordinary database fail closed.
create table if not exists public.pg_consistency_lab_marker (
    marker_id boolean primary key default true check (marker_id),
    instance_id uuid not null,
    created_at timestamptz not null default now(),
    environment text not null check (environment = 'lab')
);
The database then separates durable control records from disposable workload objects:
PostgreSQL 16
├── public.pg_consistency_lab_marker
├── lab_control
│   ├── sandboxes
│   ├── experiments and ordered events
│   ├── actors and actor operations
│   ├── workload runs and samples
│   ├── artifacts
│   └── audit log
└── lab_sbx_<opaque id>
    ├── seeded application tables
    ├── scenario-specific temporary objects
    ├── indexes, functions, and triggers
    └── generated non-login runtime role
User-provided names remain display labels. SQL identifiers are generated. A sandbox schema has the lab_sbx_ prefix and a random opaque suffix. Each sandbox is paired with a generated non-login role that receives privileges only for that schema. Query Lab and composition assertions execute under that role with a sandbox search path, transaction mode, timeouts, and result bounds. The dashboard never receives PostgreSQL credentials.
Creation is transactional. The manager verifies the marker, resolves a named profile, validates the sandbox kind and display label, creates the control record and schema, installs and seeds the template, runs ANALYZE, and finally marks the sandbox ready. If seeding fails, the schema and registration roll back together.
Deletion follows the ownership record in the opposite direction. It loads a registered sandbox, refuses a schema outside the generated prefix, checks for active lab owners, drops the exact schema, and removes the registry entry. It does not accept an arbitrary schema name from the UI. DROP SCHEMA ... CASCADE is powerful, but the dangerous part is not the SQL keyword; it is whether the caller can widen the target.
A production-shaped seed without pretending to be production-sized
I wanted the default dataset to support realistic access patterns without turning a laptop launch into a scale test. The built-in commerce and operations model therefore contains 11 connected tables:
| Table | Diagnostic purpose |
|---|---|
tenants | tenancy, plan, and regional skew |
users | tenant-scoped identities, status, recency, and JSON profile data |
products | catalog state, price, lifecycle, and JSON attributes |
inventory | reservations, sold counts, hot rows, and optimistic versions |
orders | idempotency, lifecycle, tenant feeds, totals, and versions |
order_items | multi-row order/product fan-out |
payments | provider uniqueness, attempts, and payment state |
idempotency_keys | request and result deduplication |
job_queue | priority, availability, lease, retry, and worker ownership |
outbox_events | transactional event publication state |
api_requests | route, latency, database time, and query-count history |
The template is intentionally index-rich. It contains primary and unique constraints, composite B-tree indexes, partial indexes, covering indexes, GIN indexes for JSON data, and BRIN indexes for time-shaped history. Three functions support timestamp maintenance, guarded inventory reservation, and FOR UPDATE SKIP LOCKED job claiming. Triggers update order and payment timestamps.
The smoke profile plans 195,005 rows: 5 tenants, 1,000 users, 2,000 products, 10,000 orders, and 100,000 request-history rows plus their connected data. In one observed run, PostgreSQL reported 11 tables, 36 index relations, 3 functions, and roughly 46.9 MB of total table relation storage after seeding and ANALYZE.
The local profile is much larger—25 tenants, 100,000 users, 100,000 products, 1,000,000 orders, and 5,000,000 history rows, with more than 10 million planned rows overall. It is defined so the same model can grow, but seeding it requires an explicit confirmation. Routine validation does not silently turn into a disk and memory experiment.
This distinction became one of the project’s recurring principles: production-shaped is not the same as production-sized. Skew, access paths, queues, outbox records, JSON attributes, history, and competing reads and writes can reveal the behavior I care about at bounded scale. A larger row count is useful only when the question actually depends on it.
Why a real actor must own a real connection
An HTTP request is stateless. A PostgreSQL transaction is not. Its locks, backend PID, isolation level, temporary settings, and failure state belong to one connection. If the API returned after BEGIN and later chose any pool connection for the next command, the lab would be simulating a transaction rather than holding one.
The actor manager therefore owns a dedicated PostgreSQL connection for each actor handle. The handle is opaque to clients, but its control record contains the sandbox, experiment, backend PID, owner, purpose, transaction state, TTL, cancellation state, and cleanup result.
An actor can begin, run a reviewed operation, commit, roll back, cancel, or close. A blocking database operation runs asynchronously and returns an operation handle, allowing the API request to finish while the PostgreSQL connection remains blocked. The client can inspect the operation and the lock graph separately.
Observation joins the owned identities with real PostgreSQL state from pg_stat_activity, pg_locks, and pg_blocking_pids. The wait-for edge is not reconstructed from a UI label. The lab can say that actor B is waiting on actor A because PostgreSQL reports the exact backend relationship and both PIDs map to registered actors.
Actor safety is deliberately stricter than an ordinary connection pool:
- the smoke profile permits at most eight actors;
- each actor has a bounded TTL, with an absolute maximum of 300 seconds;
- one actor can have at most one pending operation;
- operation duration, returned rows, and returned bytes are bounded;
- statement, lock, and idle-in-transaction timeouts are set on the session;
- cancellation and process shutdown roll back incomplete transactions;
- a backend can be terminated only when it is registered as lab-owned;
- a failed session reset removes the connection from the pool rather than returning contaminated state.
This work made intentional lock experiments possible. More importantly, it made their cleanup a first-class result rather than a hopeful defer at the edge of an HTTP handler.
A small transaction language instead of arbitrary orchestration
Predefined scenarios are useful, but database incidents often depend on a schedule that is slightly different from the catalog. I wanted to compose those schedules without exposing a general SQL workflow engine.
The transaction composer is a bounded JSON state machine. A composition declares one to eight actors, a TTL, and at most 64 steps. Supported steps are intentionally limited:
begin
execute_operation
wait_at_barrier
release_barrier
commit
rollback
assert_sqlstate
assert_invariant
Operations come from the actor allowlist. An invariant is one bounded read-only SELECT executed under the sandbox role. expectBlocked does not sleep for an arbitrary interval and assume a lock exists. It polls PostgreSQL until the exact actor is blocked, then stores a lock snapshot filtered to the composition’s actor IDs.
The schedule can therefore express a row-blocking experiment like this:
Actor A: BEGIN
Actor A: update inventory row
Actor A: arrive at "lock-held"

Actor B: BEGIN
Actor B: attempt update on the same row asynchronously
Coordinator: prove B is blocked by A in PostgreSQL

Actor A: COMMIT
Actor B: operation completes
Actor B: COMMIT
Coordinator: assert the final inventory version
Every terminal path—success, validation failure, timeout, explicit cancellation, emergency stop, or process shutdown—rolls back and closes every actor opened by the composition. A completed report stores step outcomes and captured evidence as a durable artifact.
This was a better fit than arbitrary SQL scripts for two reasons. First, the limited step vocabulary makes ownership and cleanup inspectable. Second, the JSON schedule is transport-neutral: the dashboard and MCP server can submit the same composition to the same runtime.
Turning the catalog into 16 executable comparisons
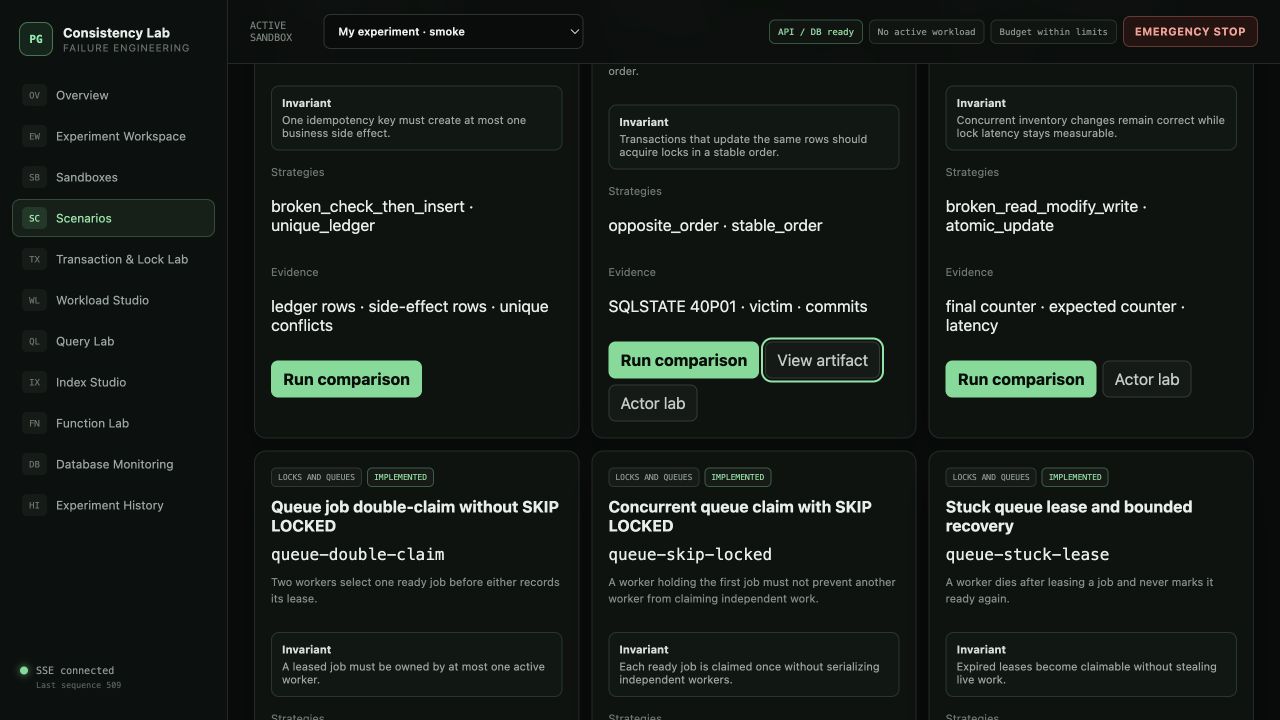
The original scenario catalog was a backlog. By the interactive-platform milestone, all 16 entries were executable against real PostgreSQL. Each one has a production story, invariant, broken strategy, fixed strategy, expected outcome, typed evidence, and exact cleanup.
Transaction anomalies
tx-lost-update is the foundational case. It compares stale application read-modify-write with atomic update, optimistic versioning, row locking, and serializable retry.
tx-write-skew models a constraint that spans multiple rows. Two transactions each observe that another row satisfies the invariant, then update different rows. Row-level repeatable reads can be individually consistent while the cross-row business rule fails. The fixed path uses SERIALIZABLE with bounded retry and preserves SQLSTATE 40001 when PostgreSQL aborts a dangerous serialization graph.
tx-capacity-phantom models two requests that both see remaining capacity and both insert. The repair moves the invariant onto a capacity counter protected by a lock instead of trusting two independent check-then-insert decisions.
tx-idempotency-race shows why checking for an idempotency key before doing work is not itself idempotency. Two requests can both observe absence. A unique ledger makes the database arbitrate the race and lets one request own the side effect.
Locks and queues
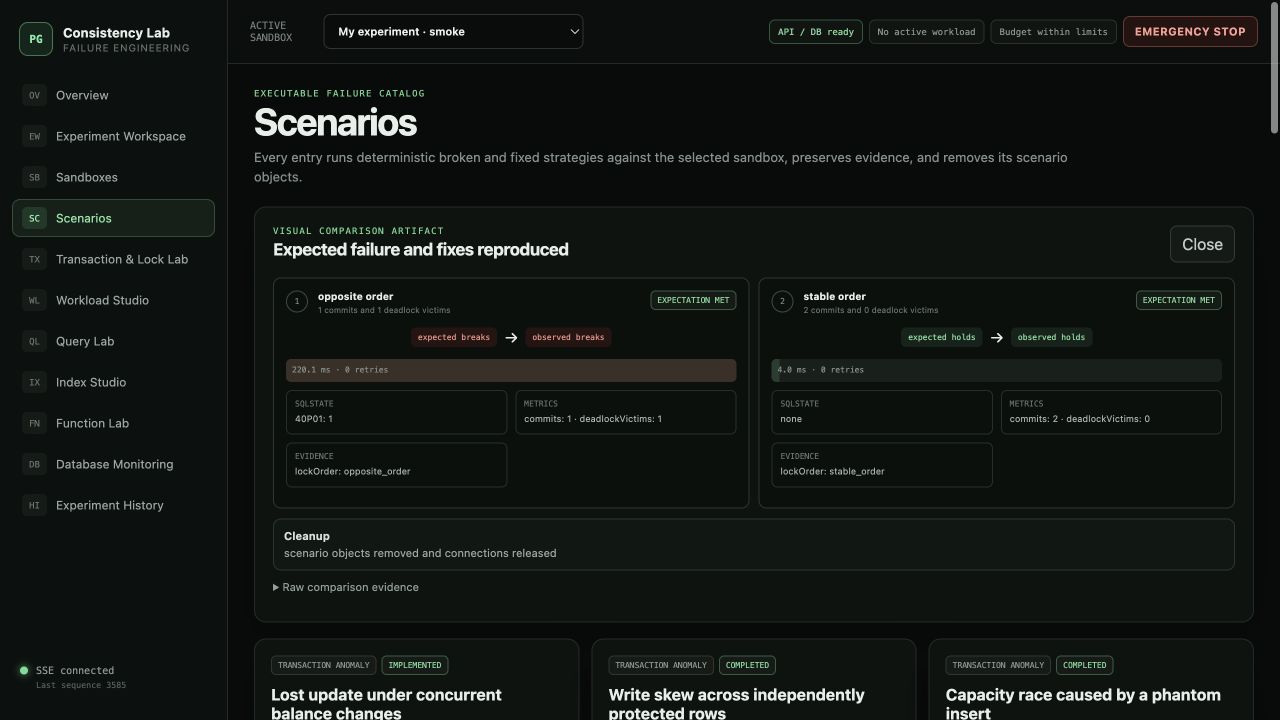
lock-deadlock-order makes two transactions update the same rows in opposite order. The broken path produces a real PostgreSQL deadlock victim with SQLSTATE 40P01. The fixed path acquires the rows in stable order, so both transactions commit. The comparison retains commit count, victim count, duration, SQLSTATE, and cleanup state rather than showing only a red or green badge.
lock-hot-row-contention compares an application read-modify-write counter with an atomic update while recording correctness and latency. It is a reminder that the same row lock can be both the mechanism that preserves correctness and the source of tail-latency pressure.
queue-double-claim lets two workers select a ready job before either records ownership. The fixed claim uses FOR UPDATE SKIP LOCKED so one lease maps to one worker.
queue-skip-locked isolates a different question: should one worker holding the first job prevent another worker from making progress on the next ready job? The comparison preserves blocking evidence and SQLSTATE 55P03 where relevant.
queue-stuck-lease models the worker that dies after claiming a job. A ready-only query can strand the work forever. The fixed strategy makes expired leases eligible again without stealing a lease that is still live.
Index and plan behavior
idx-bad-composite-order compares a composite index whose leading column does not match the tenant-and-time access path with the correct tenant/time ordering.
idx-partial-comparison compares a full status index with a predicate-matched index over the active subset. The lab records index size and plan evidence instead of assuming that a smaller partial index is always selected.
idx-covering-comparison contrasts a heap-dependent read with an INCLUDE covering index. The report retains heap fetch and buffer evidence where PostgreSQL exposes it.
idx-write-amplification compares minimal indexing with five secondary indexes under writes. This scenario exists because an index review that considers reads only is incomplete. Extra access paths have to be maintained, produce WAL, occupy storage, and alter write latency.
Index scenarios preserve PostgreSQL FORMAT JSON plan nodes rather than parsed console text. Cost, actual timing when requested, rows, loops, buffers, index names, sizes, heap fetches, latency, and WAL evidence remain structured so both the report and dashboard can use them.
Event consistency
event-missing-after-commit shows the gap between a successful business commit and a later process-local publish. If the process fails in between, downstream state never learns about a change that the database already accepted. The transactional-outbox path writes business state and publication intent together.
event-transactional-outbox makes the boundary even more explicit by comparing split transactions with one transaction that owns both the business row and the outbox row.
event-idempotent-consumer replays delivery after partial success. The broken consumer repeats its side effect. The fixed consumer records a durable ledger entry so at-least-once delivery does not become at-least-once business mutation.
The important acceptance rule across all 16 scenarios is slightly counterintuitive: a broken strategy that unexpectedly passes is a failed experiment. The lab is not rewarding green output. It is proving that the intended failure was actually reproduced, that the repair actually held, and that both paths removed their exact fixtures and released their sessions.
Workloads: pressure has a shape
Individual scenarios isolate one invariant. They do not show how several ordinary operations interact under sustained pressure. The workload engine adds that layer without turning the tool into an unrestricted load generator.
A run has separate warm-up, measurement, and cool-down phases. Workers and connection-pool slots are configured independently so connection acquisition pressure remains visible. Traffic can be rate-limited or run as quickly as the bounded worker and pool envelope permits. A deterministic seed controls each worker’s selection path.
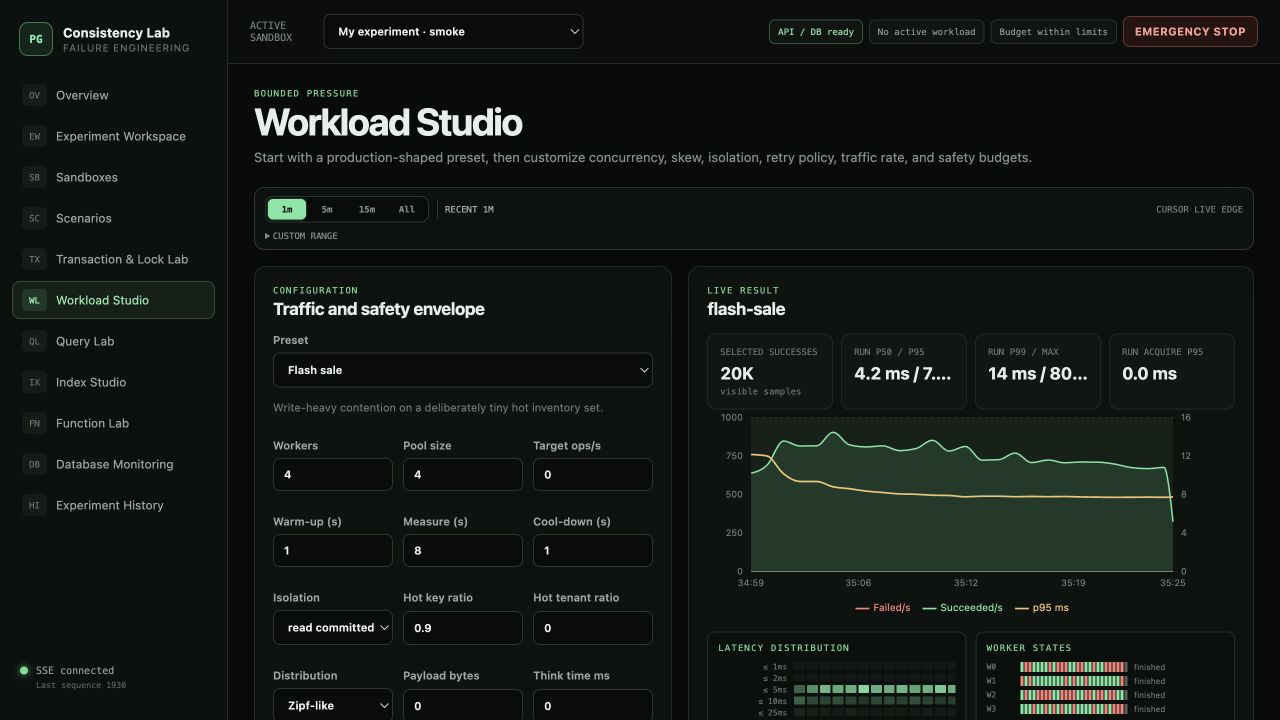
The engine includes 12 named presets:
| Preset | Pressure shape |
|---|---|
steady-traffic | read-heavy product, order, session, queue, and outbox traffic |
peak-hour | recent-order and checkout pressure with tenant skew |
flash-sale | write-heavy contention on a deliberately small inventory set |
hot-tenant | one tenant dominates feeds and writes |
hot-product | one product dominates point reads and version updates |
queue-burst | concurrent claims, completion, and outbox publication |
reporting-vs-oltp | aggregation and history scans compete with point work |
index-build-under-load | normal traffic continues during an index comparison |
function-regression | stored inventory functions compete with direct updates |
connection-saturation | short work exposes acquisition and pool pressure |
wal-heavy-writes | sustained writes produce visible WAL movement |
large-sort-hash | analytical queries expose temporary-file behavior |
Custom mixes combine 14 reviewed operations, from product reads and recent orders to inventory reservations, order creation, payment callbacks, idempotency acquisition, queue claim/complete, outbox publication, aggregation, historical scans, large sorts, and one sandbox-scoped custom read query.
The configuration surface is deliberately detailed because “four workers for ten seconds” says little about the resulting system. It includes workers, pool size, target operations per second, statements per transaction, isolation, seed, uniform or Zipf-like distribution, hot-key and hot-tenant ratios, payload size, think time, retry count and backoff, statement and lock timeouts, and operation, row, WAL, temporary-byte, and latency budgets.
Workers record actual state transitions:
rate_wait
pool_wait
connection_acquire
executing
retry_backoff
think_time
finished
Every completed operation records its selected target, latency, transaction outcome, SQLSTATE, and affected rows. One-second samples contain interval operation/error/transaction/row deltas, fixed latency buckets, worker states, connection-pool pressure, and bounded hot-target aggregates. The final report retains cumulative counts and database baseline, experiment, and recovery deltas.
The distinction between interval and cumulative data matters. PostgreSQL transaction counters and WAL values do not become rates merely because they are drawn as a line. The monitoring service labels current gauges, cumulative counters, derived interval rates, experiment deltas, and recovery deltas separately.
WAL, temporary bytes, and some database counters are cluster-wide signals. The lab uses them as conservative safety budgets and correlation evidence. It does not claim that every observed byte belongs exclusively to the selected workload. That limitation is more useful on the screen than a false level of attribution.
Query Lab, Index Studio, and bounded SQL
The project needed custom queries, but “local only” was not enough reason to expose arbitrary database control. Query Lab therefore accepts one PostgreSQL statement and executes it through the extended protocol. It does not split a string on semicolons and hope for the best.
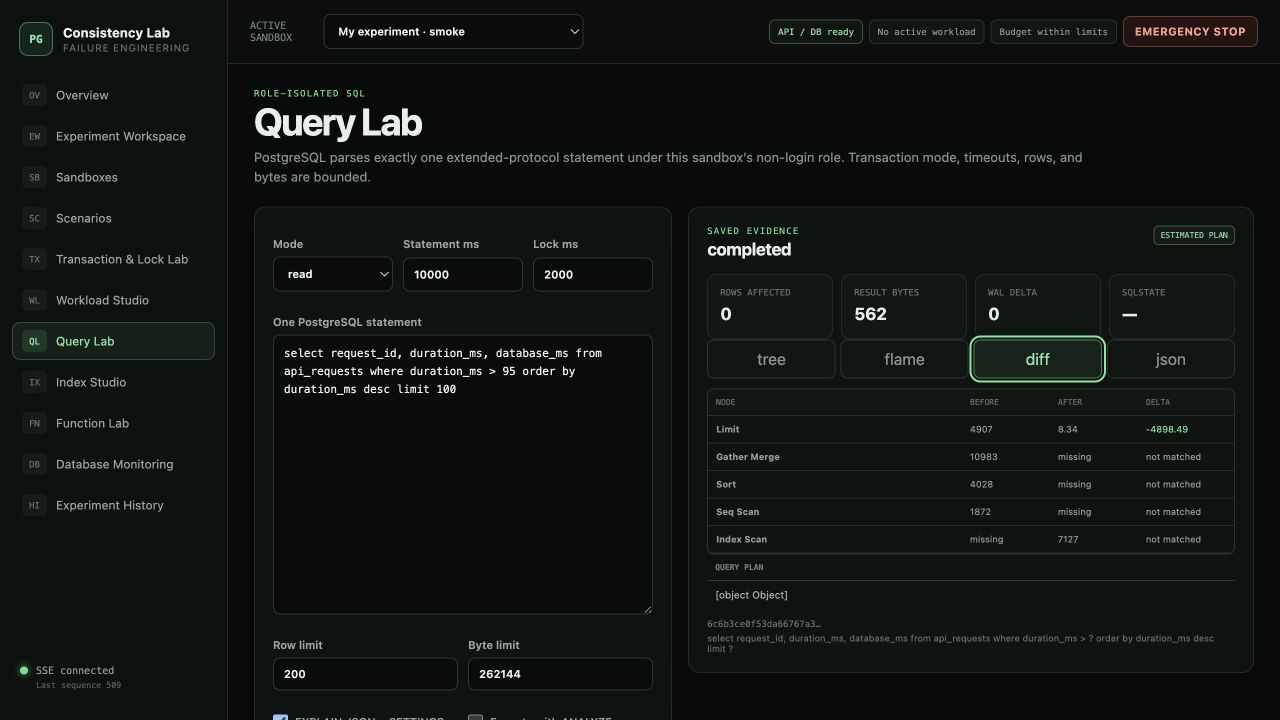
The request specifies read or write mode, statement and lock timeouts, row and byte limits, and whether to capture a plan. Execution assumes the generated non-login sandbox role. Read mode is transaction-read-only. SQL text is bounded, output is capped at 1,000 rows and 1 MiB, and duration is capped at 30 seconds. Results include normalized query information, SQL digest and preview, rows, bytes, SQLSTATE, timing, WAL delta, and a structured JSON plan artifact when requested.
There is a bounded lexical classifier, but it is only defense in depth. The actual safety boundary is the combination of one extended-protocol statement, transaction mode, sandbox role, PostgreSQL privileges, qualified ownership, timeouts, cancellation, and result limits. Calling a lexical check a full SQL parser would create exactly the kind of false confidence the lab is meant to avoid.
Index Studio performs typed mutations. Creation receives a table, columns, method, optional INCLUDE columns, and a reviewed predicate. Identifiers are built from inspected catalog metadata. Drop refuses constraint-owned indexes. PostgreSQL progress remains visible, although index create/drop is still synchronous at the adapter boundary and does not yet have its own cancellable long-operation handle.
Function Lab is intentionally more observational. It exposes inspected functions, volatility, parallel safety, definitions, and triggers. Function execution can use Query Lab, but arbitrary function creation was not opened merely to make the page look complete.
One runtime, four clients
By the main platform milestone, internal/platform.Runtime composed the sandbox, actor, composer, scenario, workload, query, monitoring, control, and safety services once. Four clients used it in different ways.
The CLI remained the smallest route. list shows the implemented catalog. A run creates an exact temporary custom smoke sandbox, starts the scenario through the shared service, polls the durable experiment, prints text or JSON, and deletes the sandbox. It does not own a second scenario implementation.
The HTTP API exposes loopback-only REST commands and snapshots under /api/v1. Request bodies are bounded, unknown JSON fields are rejected, and domain failures map to stable safe error codes. High-value route families cover sandboxes, scenarios, compositions, actors, locks, workloads, queries, indexes, monitoring, experiments, replay, artifacts, and emergency stop.
Server-Sent Events carry ordered lifecycle notifications. An event is persisted before it is fanned out. Reconnecting clients can replay at most 500 events using Last-Event-ID, and a heartbeat keeps the one-way stream observable. SSE is enough because commands already travel through REST; adding WebSocket would have created a second bidirectional command path without solving a present problem.
The MCP server exposes 32 typed stdio tools over the same runtime. It can discover profiles and capabilities, create and inspect sandboxes, run scenarios and compositions, manage actors, inspect locks, start and cancel workloads, run bounded queries, perform typed index changes, inspect experiments and artifacts, and invoke emergency stop. It does not shell out to the CLI, parse console text, accept credentials, or accept an arbitrary backend PID.
The React and TypeScript dashboard is the complete operator surface. It calls the HTTP API, subscribes to SSE, and never connects to PostgreSQL. The first usable version already had ten operational pages. The visual-observability milestone added an eleventh: Experiment Workspace.
The dashboard had to explain time, not only display numbers
The early dashboard could operate the lab, but diagnosis still required mentally joining metric cards, JSON blocks, tables, and several pages. That was not enough. Database behavior is temporal and relational. I needed to see which phase was active, when tail latency moved, which actor waited on which backend, whether a plan changed, and whether the evidence on screen was live, durable, cumulative, sampled, or unavailable.
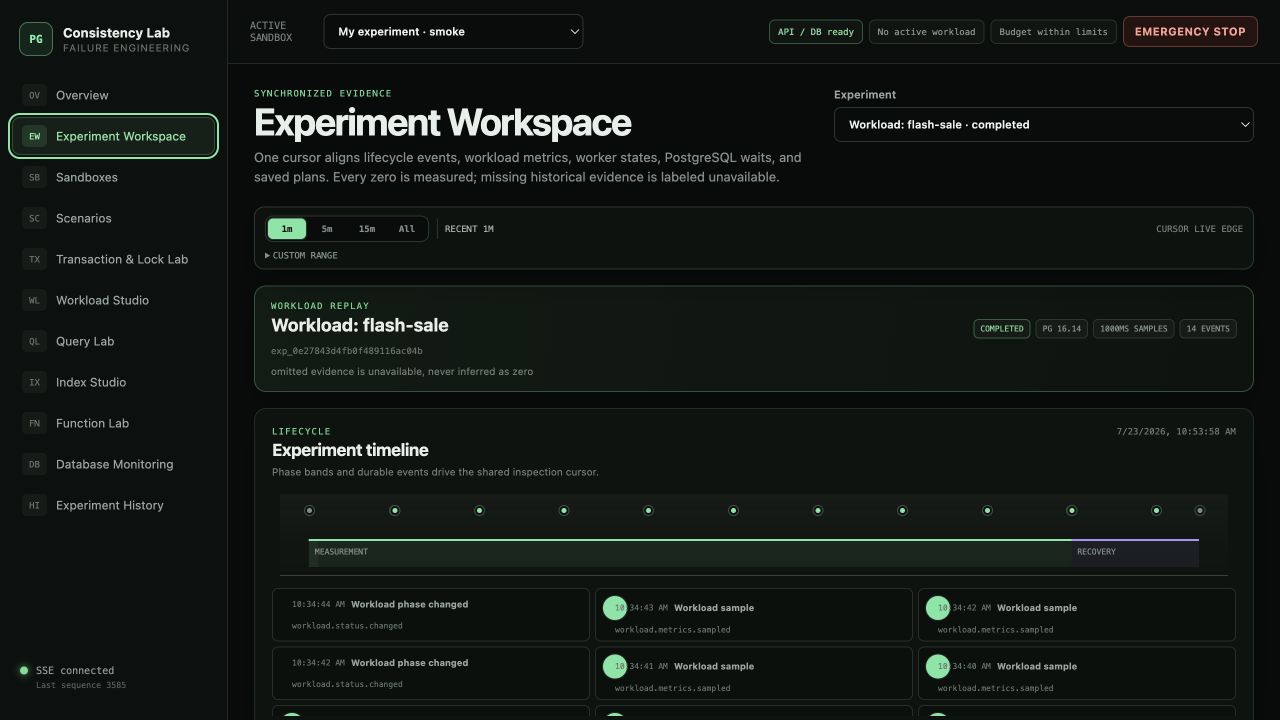
The final dashboard contains these workspaces:
| Workspace | What it owns |
|---|---|
| Overview | service health, active sandbox, safety limits, and recent experiment state |
| Experiment Workspace | synchronized lifecycle, workload, wait, actor, plan, and raw evidence replay |
| Sandboxes | create, seed, select, inspect, and delete isolated schemas |
| Scenarios | browse and run all 16 comparisons and inspect artifacts |
| Transaction & Lock Lab | manage actors, inspect blockers, and run bounded compositions |
| Workload Studio | configure pressure and inspect live and durable telemetry |
| Query Lab | execute bounded SQL and inspect plan tree, flame, diff, and JSON views |
| Index Studio | inspect access paths and run validated create/drop comparisons |
| Function Lab | inspect functions, volatility, safety, definitions, and triggers |
| Database Monitoring | sessions, locks, queries, tables, indexes, functions, progress, and rates |
| Experiment History | durable status, cancellation, artifacts, and replayable evidence |
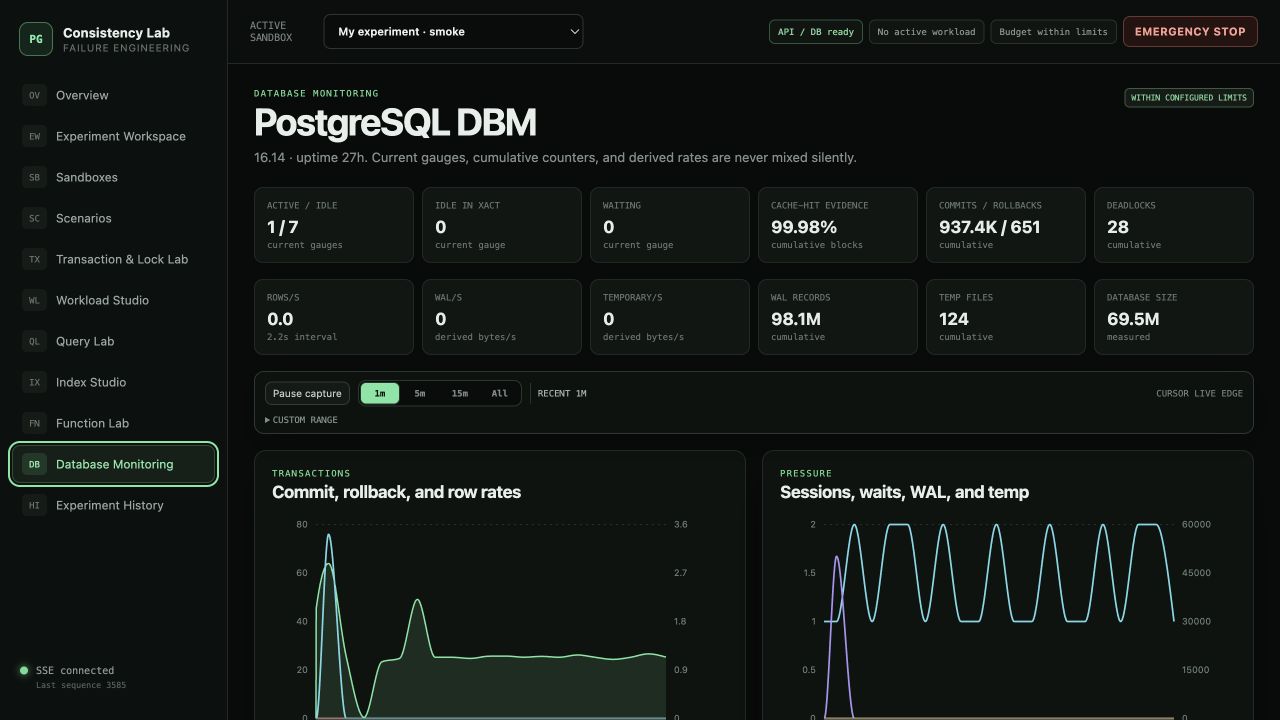
Standard time, area, bar, and line charts use Recharts. PostgreSQL-specific relationships use bounded native SVG and HTML: wait-for graphs, actor lanes, schema topology, plan trees, plan flame views, histogram heatmaps, and worker-state matrices. I did not add a general graph library for data whose maximum size and semantics were already known.
The backend gained a read-only visualization service that composes one experiment with its chronological events, artifacts, plans, workload report and samples, phase ranges, captured lock snapshots, and optional live monitoring. Completed experiments never receive a current monitoring snapshot disguised as historical data. Sandbox topology is a separate bounded catalog DTO containing tables, columns, foreign keys, indexes, functions, triggers, and storage ownership.
The Experiment Workspace uses one inspection cursor across the timeline, charts, workload samples, phases, and the nearest real captured lock snapshot. This sounds like a presentation detail, but it is an evidence contract. If the operator selects one moment, every chronological panel must describe the same interval.
A null array exposed a deeper time-contract problem
One of the most useful bugs appeared between workload creation and the first one-second sample. The Go manager initialized Samples as an empty slice. A clone operation copied the zero-length slice onto nil, so JSON encoded a valid live run as:
{
  "samples": null
}
The TypeScript contract declared an array, and the workload visualization immediately called array operations. The whole page fell into its error boundary during a legitimate empty state.
The direct fix was small: clone into an allocated zero-length slice so the API emits "samples":[]. A regression test checks both non-nil identity and the exact JSON contract. The frontend also normalizes older or transitional null collections at the API boundary, and evidence views remain null-safe.
I could have stopped there. Instead, the failure made another inconsistency obvious. Overview, Monitoring, and Experiment Workspace had one notion of a selected window; Workload Studio and History had none. A line chart could show one minute while its histogram, worker matrix, phase band, or event list still represented the full run.
The fix introduced one shared TimeRange model:
relative: recent 1m, 5m, or 15m
all:      every retained timestamp
custom:   validated absolute start and end
Relative ranges anchor to the latest retained evidence, not the wall clock. Otherwise opening yesterday’s replay and choosing “5m” would produce an empty chart. Each page merges the bounds of its available evidence, resolves one inclusive interval, filters before downsampling, clips overlapping phase bands, and sends the same interval to charts, events, locks, histograms, worker states, and hot-target views.
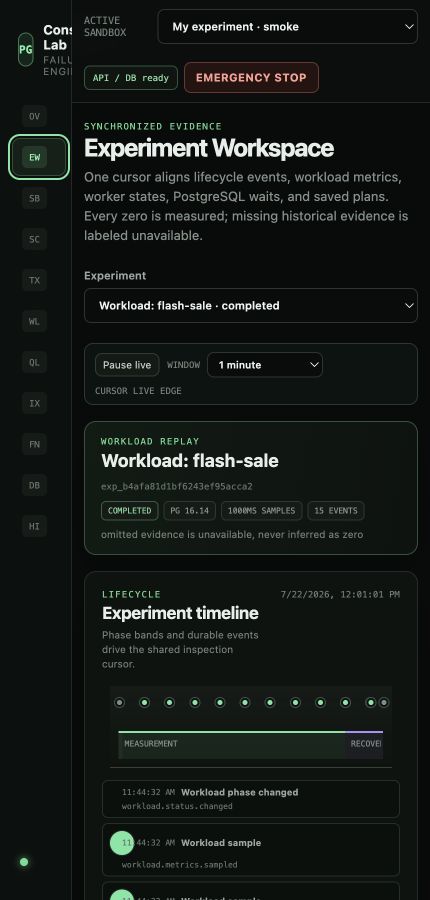
The selected cursor clears when the range changes. Invalid or out-of-retention custom ranges remain unapplied and show an inline error without destroying the operator’s draft. Switching sandboxes clears browser-only monitoring and event history so evidence cannot cross an ownership boundary. Monitoring history is capped at 360 snapshots—about 18 minutes at the nominal three-second interval—while rendered charts are downsampled to bounded point counts.
The rule underneath all of this is simple: a measured zero and missing evidence are different facts.
If no transaction is waiting in a captured snapshot, zero is meaningful. If the old experiment never stored a lock snapshot, the wait graph is unavailable. If a workload predates latency buckets, the heatmap is unavailable. If the browser was paused, resume does not invent the missed samples. The dashboard says so directly.
Emergency stop is an ownership test
A lab that intentionally creates locks, long transactions, DDL, connection pressure, and expensive queries needs a credible stop path. A global red button that calls pg_terminate_backend on whatever looks busy would be worse than no button at all.
Every HTTP and MCP mutation takes a read side of a shared runtime lease. Emergency stop takes the write side, marks the runtime as stopping, waits for in-flight mutations to leave their critical section, rejects new mutations, cancels active scenarios, compositions, workloads, and queries, rolls back registered actors, and then verifies cleanup.
No API accepts a caller-provided PID for termination. The runtime can act only on backend identities already registered to lab-owned actors or operations. Sandbox deletion is refused while a managed owner remains active. Scenario cleanup drops only the exact objects it tracked. Composer cleanup owns only its actor IDs. The emergency path returns evidence of what it attempted and what remained.
The safety envelope is explicit rather than implied:
| Boundary | Limit |
|---|---|
| shared Go pool | 80 connections, 2 minimum, 5-minute idle lifetime |
| smoke profile | 4 workers, 8 actors, 60 seconds |
| local profile | 32 workers, 64 actors, 900 seconds; seeded data requires confirmation |
| actor | 300-second absolute TTL and one pending operation |
| actor operation | 60 seconds, 100 rows, 64 KiB result |
| composition | 8 actors, 64 steps, 120 seconds plus profile cap |
| workload | 10,000 ops/s, batch 100, 10 retries, 5,000,000 operations plus budgets |
| workload evidence | 600 samples and 50,000 retained latency observations |
| Query Lab | 30 seconds, 1,000 rows, 1 MiB result, 32 KiB SQL |
| events and artifacts | 500-event replay, 64 KiB event, 2 MiB artifact |
The numbers are not presented as ideal limits for every machine. They are reviewable defaults that prevent an innocent dashboard input from becoming an unbounded operation.
Validation had to use PostgreSQL, not a mock of PostgreSQL
Unit tests cover validation, catalogs, adapters, serialization, transforms, and frontend components. They cannot prove a deadlock, a serialization failure, a blocker edge, SKIP LOCKED ownership, a query plan, or session cleanup.
The integration suite therefore runs against the real Docker PostgreSQL 16 instance. It covers actor blocking and TTL expiry, composer barriers, every scenario report, workload phases and safety budgets, Query and Index boundaries, audit and ordered events, REST and MCP parity, cancellation, emergency stop, CLI temporary-sandbox cleanup, and profile seeding. Selected concurrency packages also run under Go’s race detector using a cgo-capable container.
The dashboard has separate type checking, unit tests, and a production build. The final time-range delivery passed five frontend test files with 15 tests. The production build kept chart code in lazy chunks so Recharts did not enter the initial application bundle.
The most important tests assert cleanup as part of success. The all-catalog integration run executed all 16 entries against one exact custom smoke sandbox, confirmed every broken and fixed expectation, matched the number of comparison artifacts to the catalog, and then verified that no tracked scenario tables or experiment sessions remained.
The main platform acceptance run observed, among other results:
- lost update produced
110/120for the broken path and120/120for all four repairs; - serializable retry exposed a real
40001conflict; - the deadlock comparison produced one
40P01victim under opposite ordering and two commits under stable ordering; - queue blocking exposed
55P03evidence; - an event-consumer comparison produced two side effects for two broken deliveries, versus one side effect and one ledger row for the fixed path;
- a row-lock composition completed ten of ten steps, preserved its invariant, and left zero actors;
- one query/index run changed a sequential scan plus sort at 1.461 ms and 144 shared hits to an index scan at 0.155 ms, 8 hits, and 2 reads in that local state;
- emergency stop ended a custom serializable workload in about 517 ms and left zero
pcl/%backends.
The visual-observability acceptance run later recorded a flash-sale workload with 8,646 attempts, 8,643 successes, 3 timeouts, 1 retry, p95 latency of 6.237 ms, and 1,886,284 observed WAL bytes. Its query-plan comparison changed an estimated root cost from 4,907 to 8.34. The responsive dashboard fit a 430-pixel viewport without document-level horizontal overflow.
These are useful results because they prove the evidence path in one controlled environment. They are not PostgreSQL capacity claims. Warm local caches, Docker Desktop, one PostgreSQL version, a smoke dataset, and short measurement windows cannot predict production throughput or latency. The article would be less accurate if it presented the most impressive number without its boundary.
The project failed in useful ways while it was being built
The clean final architecture hides several failures that influenced it.
The first was architectural. The Kotlin scaffold was replaced before it accumulated real implementation. Keeping it only because it was the first choice would have made the later dashboard and MCP work harder to compose. The lesson was not “always use Go”; it was that a scaffold should be cheap enough to discard when the control-plane requirements become clearer.
The second appeared in concurrent integration tests. A workload test used a 64 MiB cluster-WAL ceiling while index scenarios were running in parallel. The workload could stop because another valid lab experiment moved the same cluster-wide counter. That was not merely test flakiness. It exposed the difference between a conservative safety signal and exact per-run attribution. The tests were split so one path uses a deliberately high shared-counter ceiling and another dedicated run proves the one-byte WAL stop.
The same concurrent suite found composer artifacts containing unrelated global actor edges. The fix filtered lock snapshots to the exact composition actor IDs. Again, the failure improved the product contract: evidence that is correct globally can still be wrong for a scoped experiment.
The dashboard proxy intermittently returned 502 through a Docker Desktop host-hairpin route even though direct API and container-to-container health checks passed. The application services were placed on an idempotent named Docker network, and Vite now proxies directly to the API container by DNS while published ports remain loopback-only.
The samples: null crash demonstrated that a typed frontend cannot repair a dishonest transport contract by declaration alone. Fixing both producer and consumer was necessary because durable or older payloads can outlive the backend bug.
The time controls exposed a subtler interaction problem: controlled native date inputs could lose an in-progress edit during a periodic parent render. The final control lets the browser own the draft until Apply, then validates and commits it to shared range state.
Each of these failures points to the same engineering rule. Observability is not the act of drawing data. It is preserving ownership, time, scope, and absence all the way from the database to the screen.
What I would not claim after building it
PostgreSQL Consistency Lab is intentionally broad, but it is not a production database administrator.
It does not connect to a real production database. It has no remote authentication model, no multi-user tenancy, and no unrestricted database, role, extension, or server control. MCP is local stdio. The API and dashboard bind to loopback. Open transactions do not survive control-plane process restart.
Monitoring history outside an experiment remains browser-memory-only. If the browser was closed, a 15-minute selection cannot recover samples that were never collected. Durable experiment replay is the historical source of truth.
Lock history exists only where a composition or capture path persisted a snapshot. A completed scenario report cannot reconstruct every intermediate lock edge after the fact. Actor lanes also cannot recreate metadata that was never stored in older events.
Index creation and deletion remain synchronous. A large index build can be observed through PostgreSQL progress, but it does not yet have a dedicated cancellable operation handle. Plan-node matching intentionally leaves a replaced scan strategy unmatched rather than inventing a false correspondence.
WAL, temporary-file, and database counters are useful cluster-wide evidence, not perfect workload attribution. Query Lab’s lexical classifier is not a complete SQL parser. Local timings are comparative evidence, not capacity promises. The guarded local profile is defined, but the default validation story remains the smoke profile.
Those limits are not an appendix added to make the project sound responsible. They are part of its design. The lab became useful precisely because it stopped pretending that every visible number had the same provenance.
What the project became
The repository began with a list of database failures that I wanted to reproduce. It ended with one shared Go runtime, a marked PostgreSQL instance, generated sandbox schemas and roles, durable control records, managed connection-bound actors, a bounded transaction composer, 16 deterministic scenario comparisons, 12 workload presets, 14 reviewed operations, Query and Index Labs, PostgreSQL monitoring, replayable events, 32 MCP tools, and an eleven-workspace React dashboard.
The size of that list is not the part I value most.
The important part is that the system connects a business invariant to the database event that violated it. It can show that two successful commits produced the wrong balance. It can stop while one actor is genuinely blocked by another. It can retain the SQLSTATE that made a retry necessary. It can compare a query plan without erasing the write cost of the index. It can display zero when zero was measured and unavailable when nothing was captured. It can generate dangerous conditions and still refuse to touch an unregistered backend.
That is why the dashboard did not become decoration around the scenario runner. It became the place where all of those evidence boundaries meet.
What I originally wanted was a better way to study transaction anomalies. What I actually built was a local environment for asking a harder question: when a database system says that something succeeded, what evidence is required before I believe that the business invariant survived?
- Repository: PostgreSQL Consistency Lab