Where the Problem Started
Performance problems are hard to solve by intuition. More important than saying an API is slow is reproducing which request breaks which metric under which load. This post records how I started building a basic load-test setup with JMeter and reading the resulting signals.
I will do load and performance testing with JMeter.
JMeter is a unit testing tool focused on Java-based applications. Testing tools for other languages include NUnit(.NET), pytest(python), and so on.
JMeter is commonly used for SOAP and REST service testing, but it can also test databases, FTP, SFTP, and similar targets. It can also be wired into CI/CD through tools such as Jenkins.
To use it, first download Apache JMeter from the official website, extract it, go to the bin directory, and run jmeter. Since it is not an application, you cannot keep it in the Dock or run it by clicking an icon. On macOS, you can use Automator to make it a little more convenient.
How I Verified It
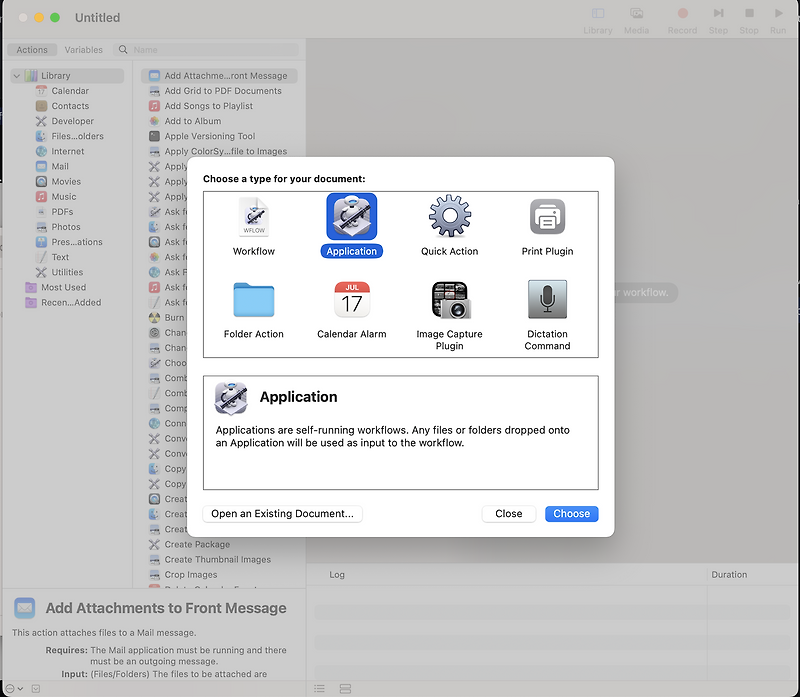
Run Automator, choose Application, then select run shell script on the left. You can run the previous steps as a macro. For example:
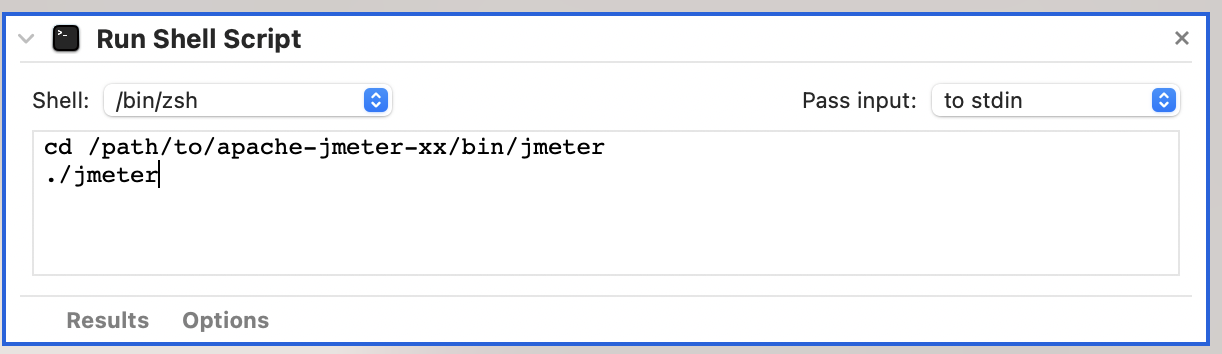
If you write a script like this, it moves to the directory and runs jmeter. After that, you can run it like a normal application.
With the test plan configured, JMeter can run a repeatable load test. Unlike a manual API tool such as Postman, it can send many requests in one controlled run.
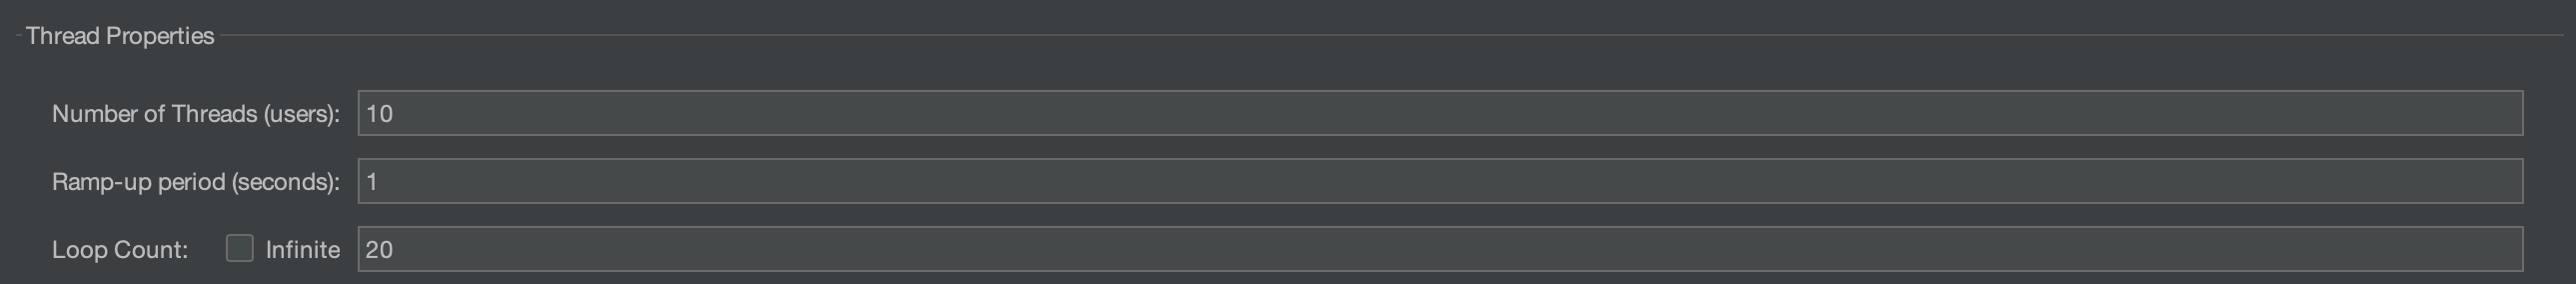
Here you can configure the number of threads, loop count, and so on. With this, 10*20 requests are sent at once.
To configure a test, go to Thread Group -> Add -> Sampler -> HTTP Request. There you set the protocol (http / https ..), server host, port number, and request method.
For a simple GET request, there are often no separate parameters, but for POST or PATCH, body data is usually needed. This can also be configured.
You can keep this static, or if you want to send a different request each time, you can attach a csv file. Alternatively, you can write a simple randomization script.
If you want to use a script, go to Add -> Pre Processor -> JR223 preprocessor. Writing it in groovy is convenient.
Implementation Path
int wordLength = (int) (Math.random() * 5) + 1;

StringBuilder word = new StringBuilder();

for (int i = 0; i < wordLength; i++) {
    char randomChar = (char) ((int) (Math.random() * (0xD7A3 - 0xAC00 + 1)) + 0xAC00);
    word.append(randomChar);
}

vars.put("KoreanWord", word.toString());
This stores a random string in KoreanWord. You can just put it in the parameter tab as value : {KoreanWord}.
After running it, you need to look at the results. If you go to Thread Group -> Add -> Listener, there are Result Tree, Summary Report, and so on.

JMeter records the result metrics in this view.
Rather than looking here, if a metric tool such as Grafana is configured, you can inspect the details better there.
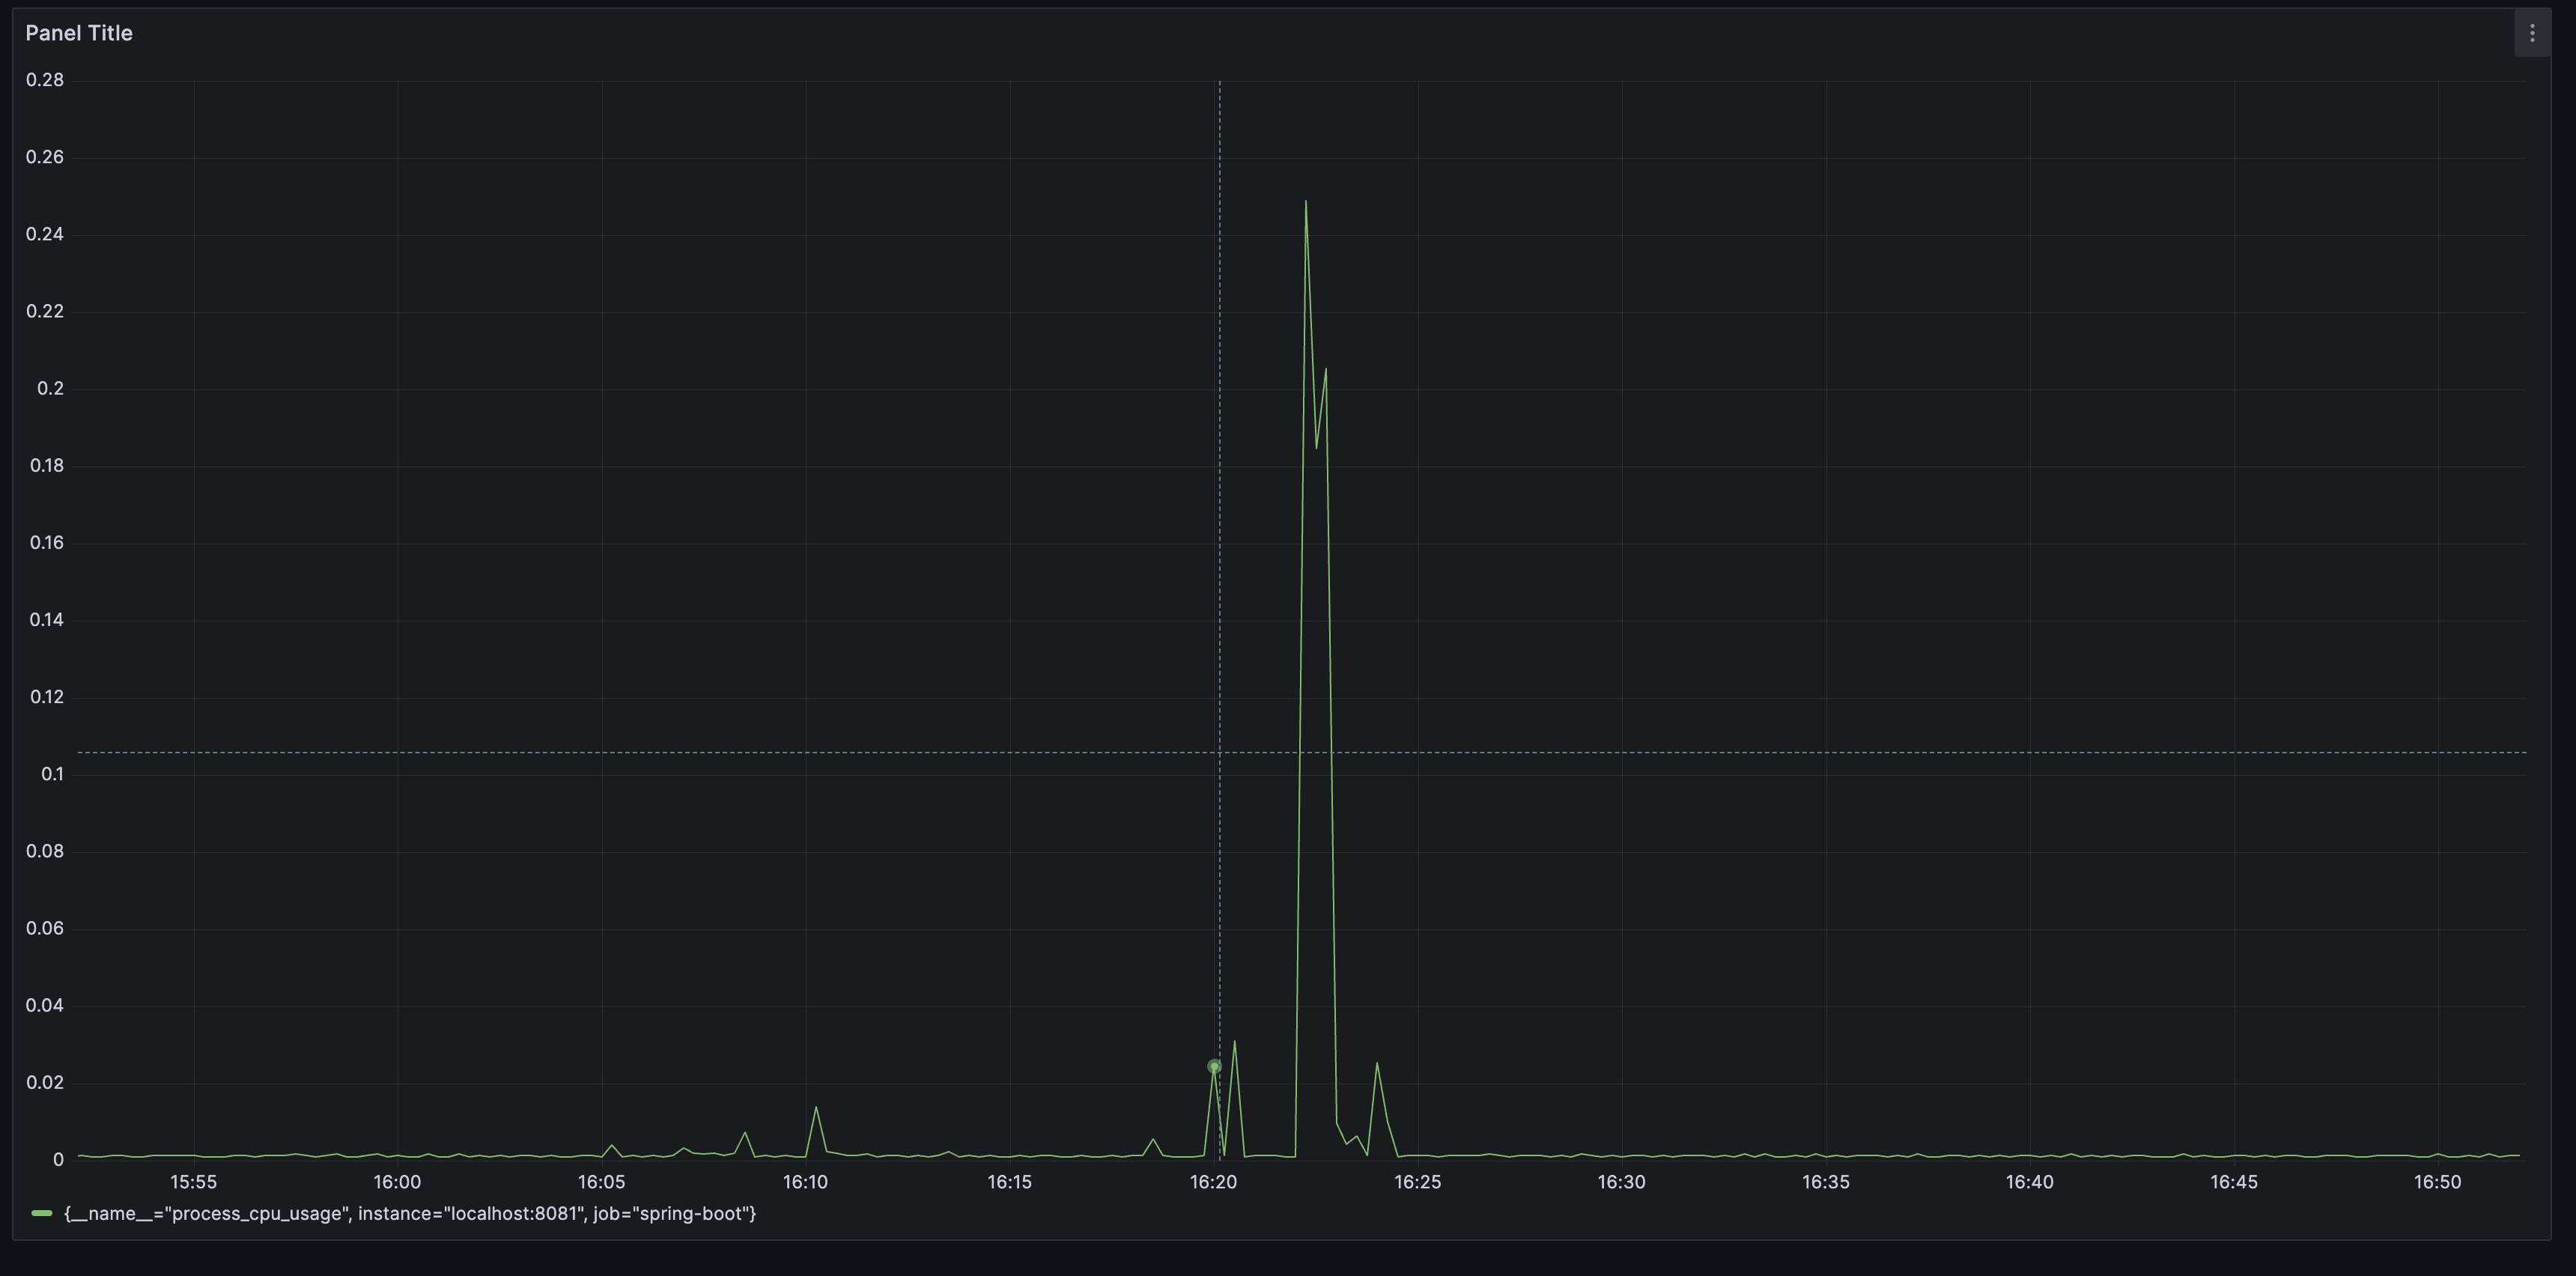
The CPU usage graph shows a sharp increase during the test window.
Testing Takeaway
The value of JMeter is not in pressing a button and getting a TPS number. It is in making a scenario repeatable and showing the relationship between thread count, latency, and error rate. Load testing should not be the last step of performance work; it should be the first controlled experiment for finding the bottleneck.
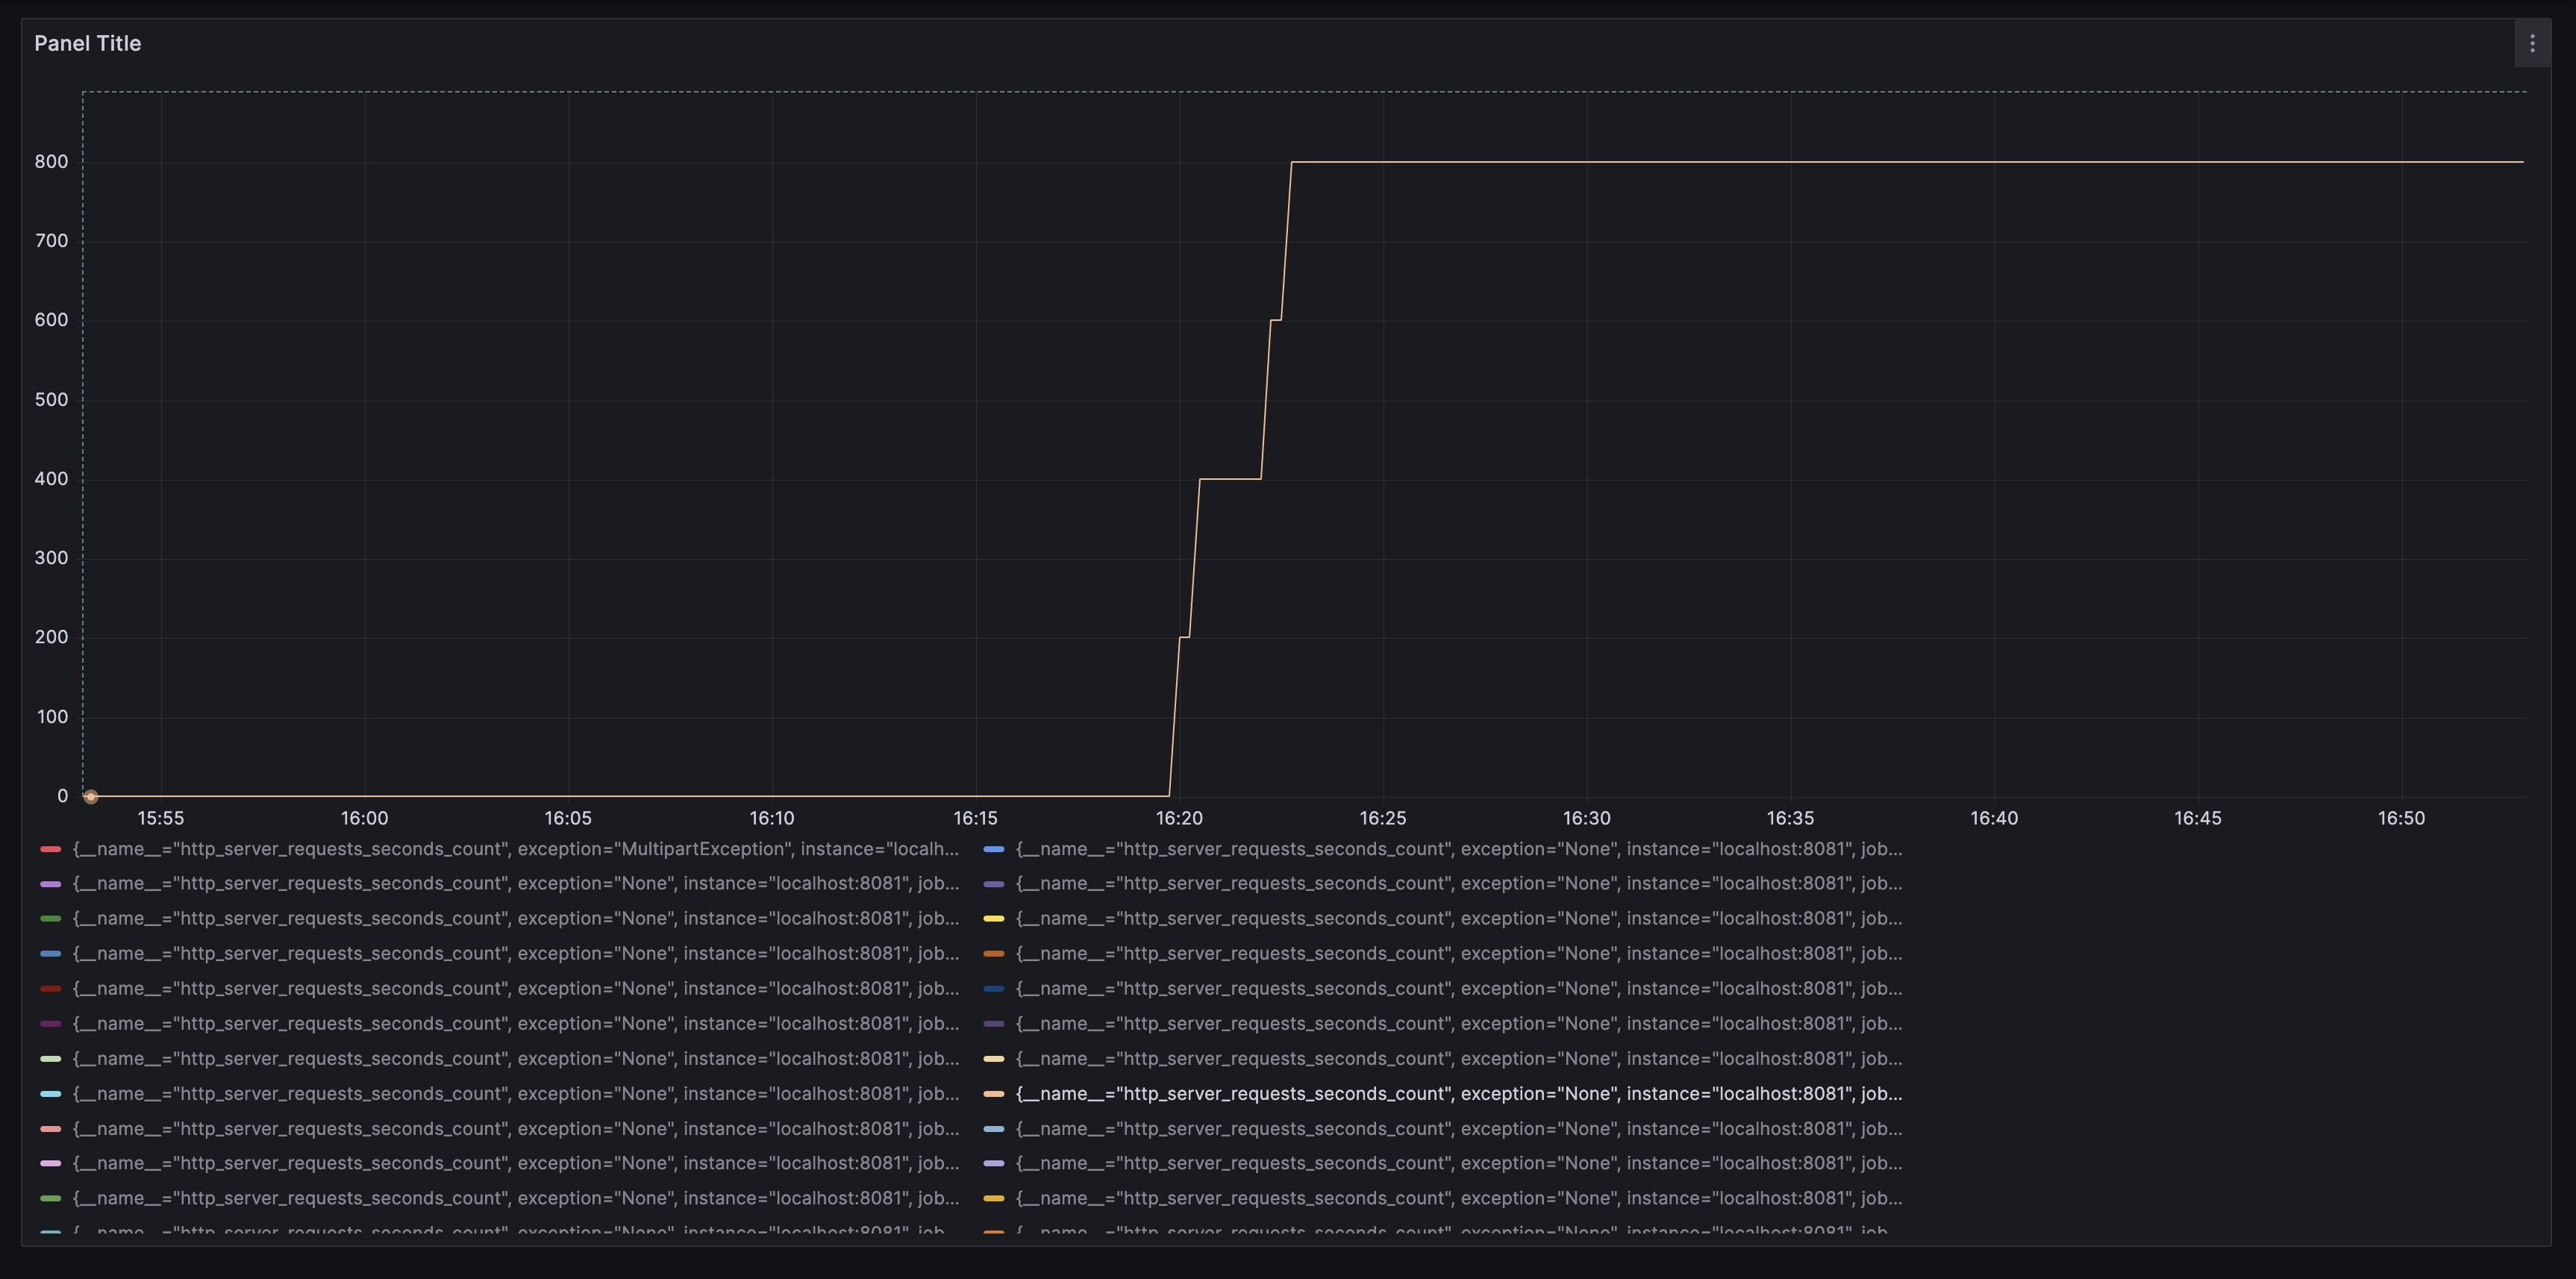
You can also see the HTTP request count.