On this page
The initiative: understand the whole local workspace
DevBerth began with a familiar local-development problem. I would start a frontend or API, discover that 5173 or 8080 was already occupied, and open a terminal to work out what was there. The routine was always similar: run lsof, copy a PID, check ps, look at Docker just in case, and try to remember whether I had started the process from a terminal, an IDE, or another tool that would bring it straight back after I killed it.
Finding a PID was easy. Understanding what the PID represented was not.
The first initiative was deliberately small: build a native macOS port viewer that connected TCP and useful UDP listeners to their processes. I wanted one place where I could answer “what is using this port?” without assembling the answer from several commands. A sortable table, a process inspector, and a Stop button seemed like enough.
As soon as I tried to make Stop reliable, the project became much larger.
A modern development workspace is rarely one process. It may contain a frontend dev server, an API, a database, a mobile bundler, a reverse proxy, a tunnel, a worker, and several containers. One process may own several listeners. A host port may really be published by Docker. A Compose service may have a container, a host process, a restart policy, and a project directory that all matter. Homebrew or launchd may recreate a process after it exits. An IDE task and a system process may share the same executable name. A PID can even be reused between inspection and execution.
Traditional port tools are good at isolated facts. Process managers are good at processes they launched themselves. I wanted DevBerth to connect those two views without pretending they had the same level of trust.
That led to the central product rule: seeing a process is not the same as having authority to control it.
The rule becomes easier to reason about when it is split into three questions:
- What is running right now?
- What did I deliberately configure to run?
- What is DevBerth actually allowed to control right now?
The first answer comes from operating-system evidence. ObservedListener and ObservedProcess are built from bounded lsof and ps collection plus structured Docker output. They describe the machine during one refresh. The information may be incomplete, and it begins to age as soon as it is collected.
The second answer is durable user intent. A ManagedServiceConfiguration records an executable or launch mechanism, separate arguments, a working directory, expected ports, dependencies, readiness and health checks, shutdown and restart policies, bounded log settings, and opaque Keychain references. A RuntimeInstance represents one actual execution of that reviewed definition.
ObservedListener / ObservedProcess
  what the machine looks like now

ManagedServiceConfiguration
  what I reviewed and intended to run

RuntimeInstance
  one actual run of that configuration
The distinction matters because a process snapshot is not a launch recipe. It may omit shell expansion, environment variables, credentials, supervisor behavior, or the real working directory. A visible Docker process may only be an implementation detail of a Compose service. A shell command may be the middle of a longer chain.
DevBerth can discover service candidates from project files, but discovery stops at suggestion. It never executes a candidate while scanning and never silently promotes an observed process into something restartable. I have to review the definition before the app can claim it knows how to launch it again.
The third answer—current control authority—must be resolved at action time. A familiar command, matching port, inferred project, old PID, or similar container is useful context, but none of those alone authorizes a mutation.
This separation became the foundation of the entire product:
- Runtime shows what the machine currently exposes.
- Projects describe how reviewed services belong together.
- Sessions capture the workspace state I expect.
- Managed Services define what DevBerth may reliably launch.
- History records what actually changed.
- Docker adds container and Compose ownership when it can be proved.
- Settings exposes safe preferences, permissions, diagnostics, and integrations.
- MCP lets Codex use the same application-owned control plane instead of creating another one.
The app is native SwiftUI and local-only. It does not require an account, administrator privileges, or a cloud service. There is no analytics, telemetry, advertising SDK, cloud sync, crash-upload service, or observed-runtime upload endpoint. Process and resource values stay on the Mac. Secret-like environment values live in Keychain rather than SwiftData.
On first launch, the welcome guide explains these boundaries before offering four useful starting points: review the current Runtime, import or create a Project, create and validate a Managed Service, or capture a Workspace Session. It also explains that macOS visibility may be limited, that discovery is not management, and that reliable restart requires a reviewed definition.
DevBerth works without Full Disk Access, but macOS may hide some same-user process metadata. Settings can open the correct Privacy & Security page when broader visibility is useful; the app cannot and does not grant that permission to itself.
The project is currently distributed from source, and the complete repository is public at ysbc1247/portpilot-macos on GitHub. The stable build script creates the Release app, verifies the bundle, replaces /Applications/DevBerth.app atomically, and installs the matching MCP helper under Application Support. There is not yet a Developer ID-notarized download or automatic updater, so I keep that limitation explicit rather than presenting the source build as a finished consumer distribution.
That is the initiative in one sentence: make the whole local workspace understandable, then allow control only where the current evidence and reviewed intent actually support it.
A complete tour from Runtime to Settings
The product uses one stable navigation order: Runtime, Projects, Sessions, Managed Services, History, Docker, and Settings. Each destination has a main collection view, while a contextual inspector or preview explains the selected item. I chose that structure because the app contains a lot of evidence, but I did not want a separate dashboard inventing a second version of the same state.
Runtime is the live view of the machine. It discovers TCP listeners and meaningful bound UDP endpoints across IPv4 and IPv6, then connects them to the process metadata macOS makes available. The same snapshot can be shown as a customizable table or grouped by inferred project.
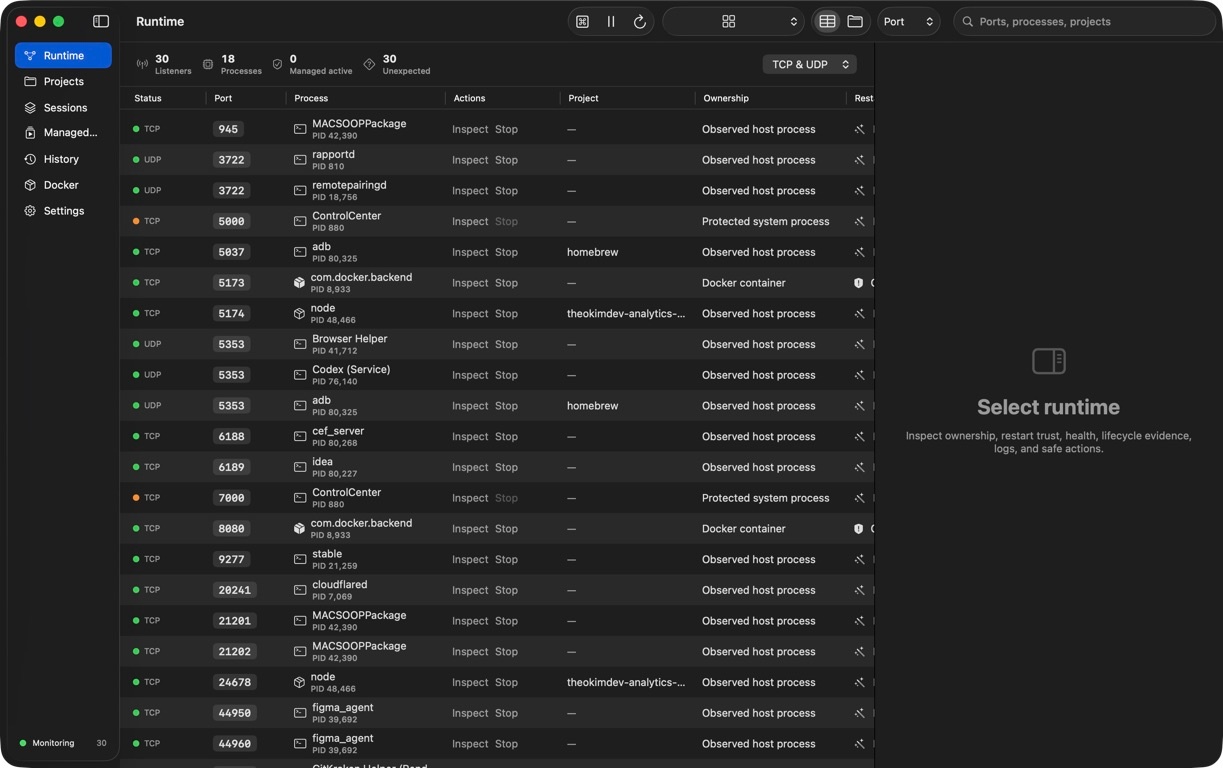
Search covers ports, protocols, addresses, process names, commands, and projects. Sorting covers port, process, project, runtime, and uptime. Saved views narrow the list to All Runtime, Managed, Unexpected, Unhealthy, Docker, or Externally Reachable. The table keeps the fields I check most often together: status and protocol, port, process and PID, project, ownership, restart trust, health, runtime, uptime, CPU, and resident memory.
Native selection supports keyboard traversal and multiple rows. Multi-selection summarizes listener and process counts and resource totals, but it deliberately does not offer an ambiguous “stop everything selected” button. A group of rows may contain several owners and several safety levels, so bulk destruction would hide exactly the distinction the app is meant to preserve.
Selecting one runtime opens the inspector. It explains the network listeners, process identity, observed command, working directory, parent evidence, project inference, managed-service relationship, restart trust, health, recent lifecycle events, Docker association, logs, and currently safe actions. “Why is this running?” is answered with bounded lineage and confidence-labeled ownership evidence. Missing or permission-limited data is shown as unavailable rather than guessed.
Transient CPU and resident-memory usage come from one bounded batched reader. Docker metadata is attached when an exact container or Compose relationship is available. A listener can show active managed state, unexpected state, unhealthy state, or externally reachable scope without turning those classifications into control permission.
Inspect and Stop remain close to each process because they are common tasks, but Stop is routed through the resolved owner. Root-owned and recognized system processes stay protected. An observed host process requires explicit confirmation and fresh fingerprint, listener-edge, user, protected-process, and owner-context checks.
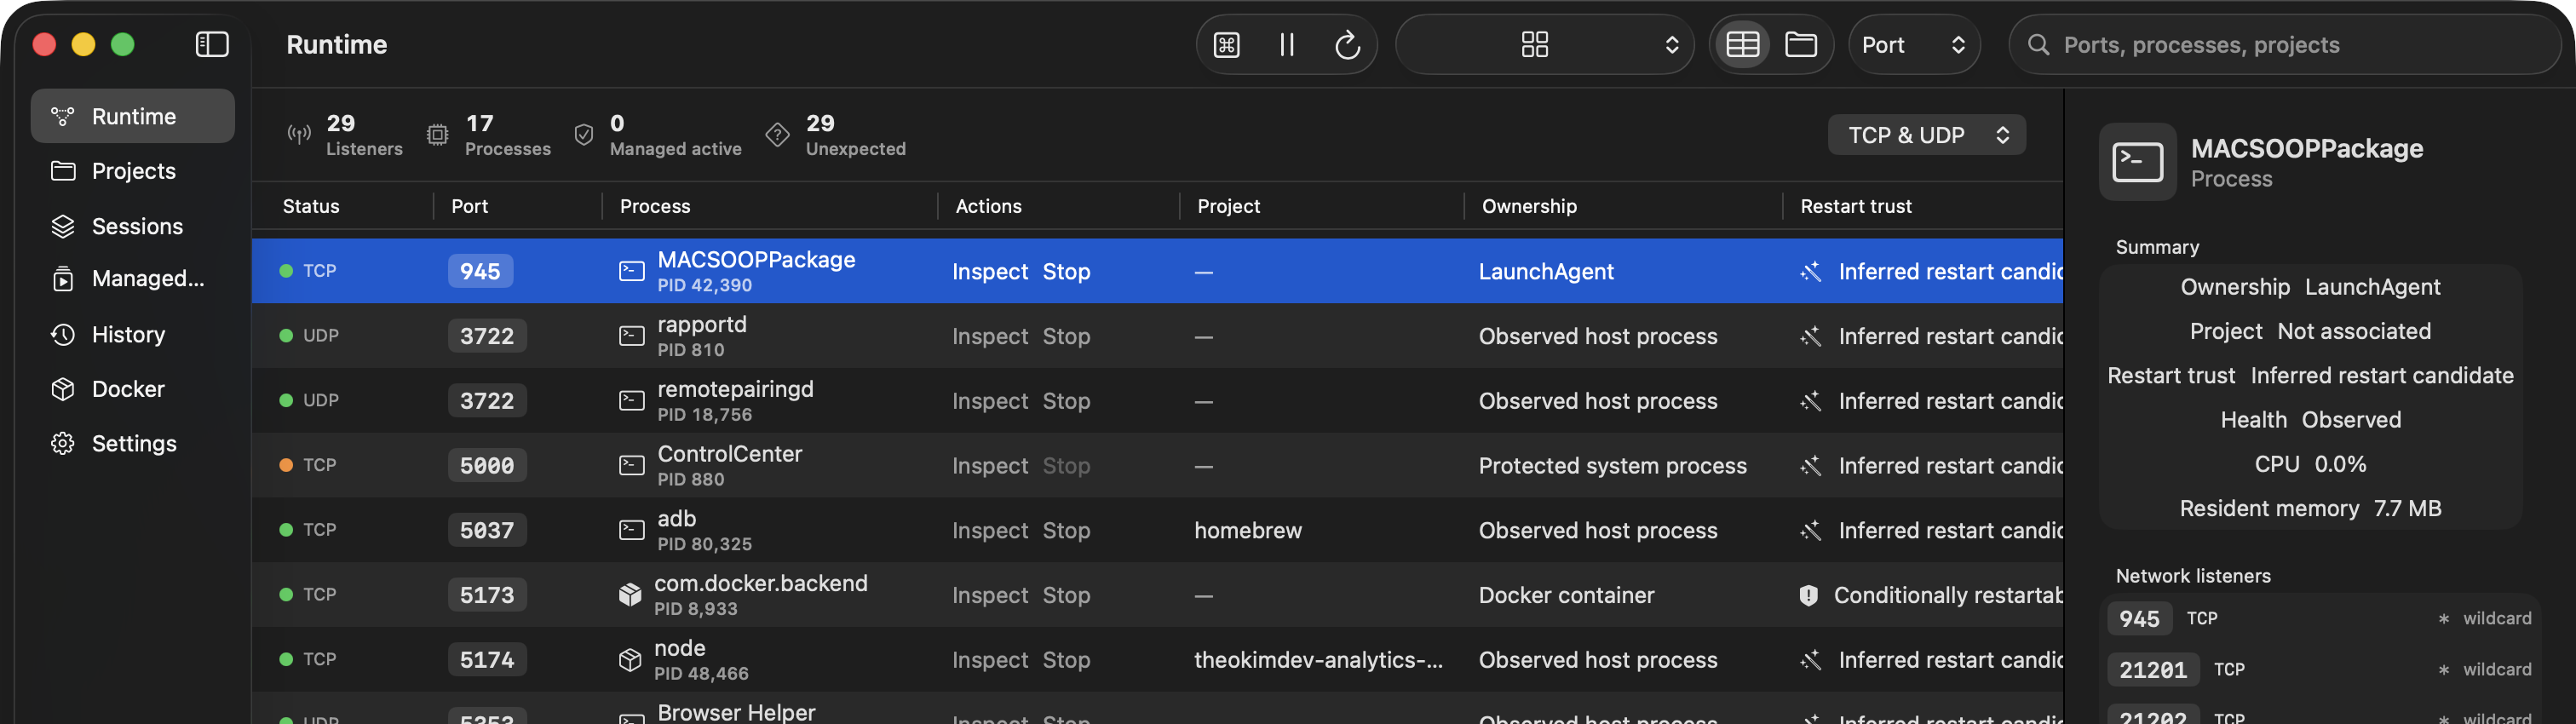
Projects move the unit of work from a port to a workspace. A project groups reviewed services, their expected ports, and dependency edges. The project view shows current observed or DevBerth-controlled activity, health and lifecycle state, Docker relationships, startup layers, incomplete dependencies, cycles, and recent failures.
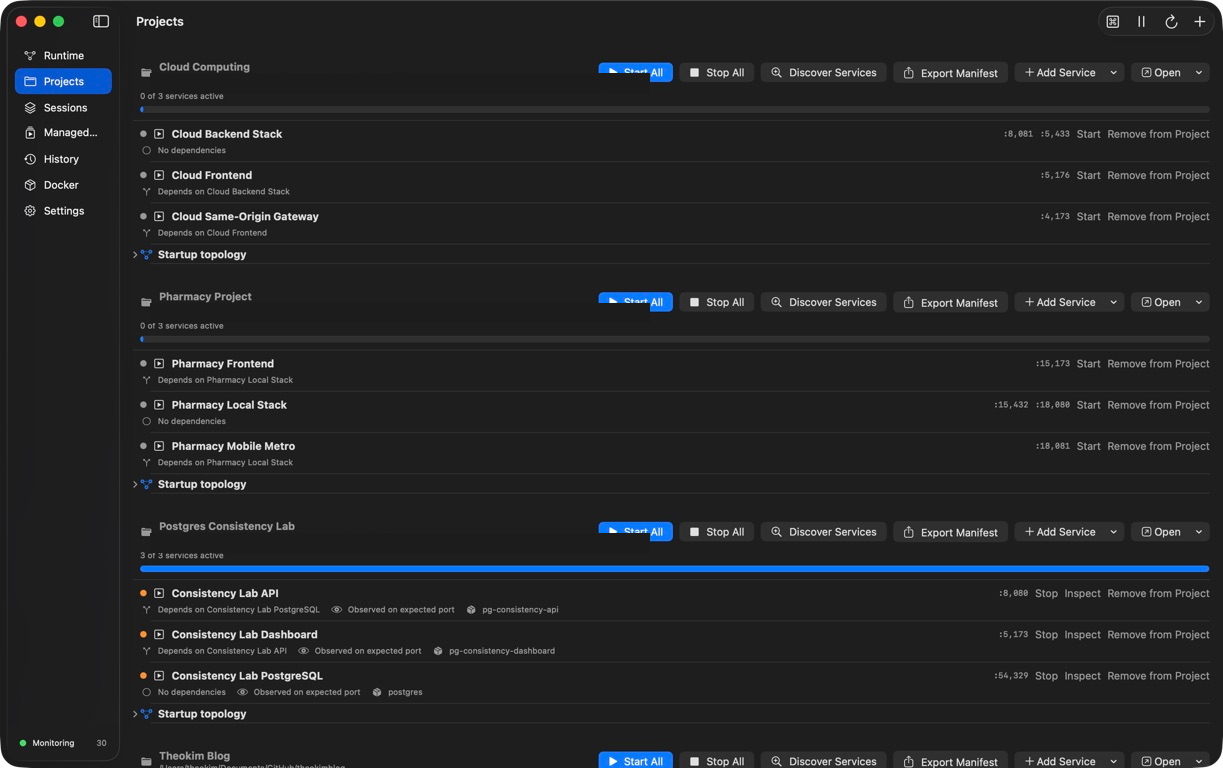
Start All launches only stopped definitions that are currently verified. It preserves the complete dependency graph, so a database can become ready before the API that needs it and independent services can start in parallel where the graph allows. Stop All walks the graph in reverse, attempts every relevant target even if one fails, and keeps visible per-service progress and final results. Start, Stop, and Inspect are also available on each service row.
Projects can be created manually or populated through Discover Services. Discovery reads supported files only inside a root I explicitly select. It recognizes JavaScript package managers, Gradle, Maven, Python, Go, Cargo, Docker Compose, Procfile, and Process Compose definitions. The scan is bounded and non-recursive, rejects unsafe paths, and never evaluates a project command.
Discovered services remain unreviewed candidates. I can edit arguments, directories, expected ports, checks, and dependencies before importing them. Projects can also export a versioned devberth-runtime.json manifest. The export deliberately excludes secret values and even Keychain reference identifiers, so it can describe runtime intent without becoming a credential bundle.
Sessions capture a development workspace without pretending to capture a shell session. A Workspace Session stores selected projects and the expected running or stopped state of their managed services. It does not persist arbitrary process objects or assume that an old PID still matters.
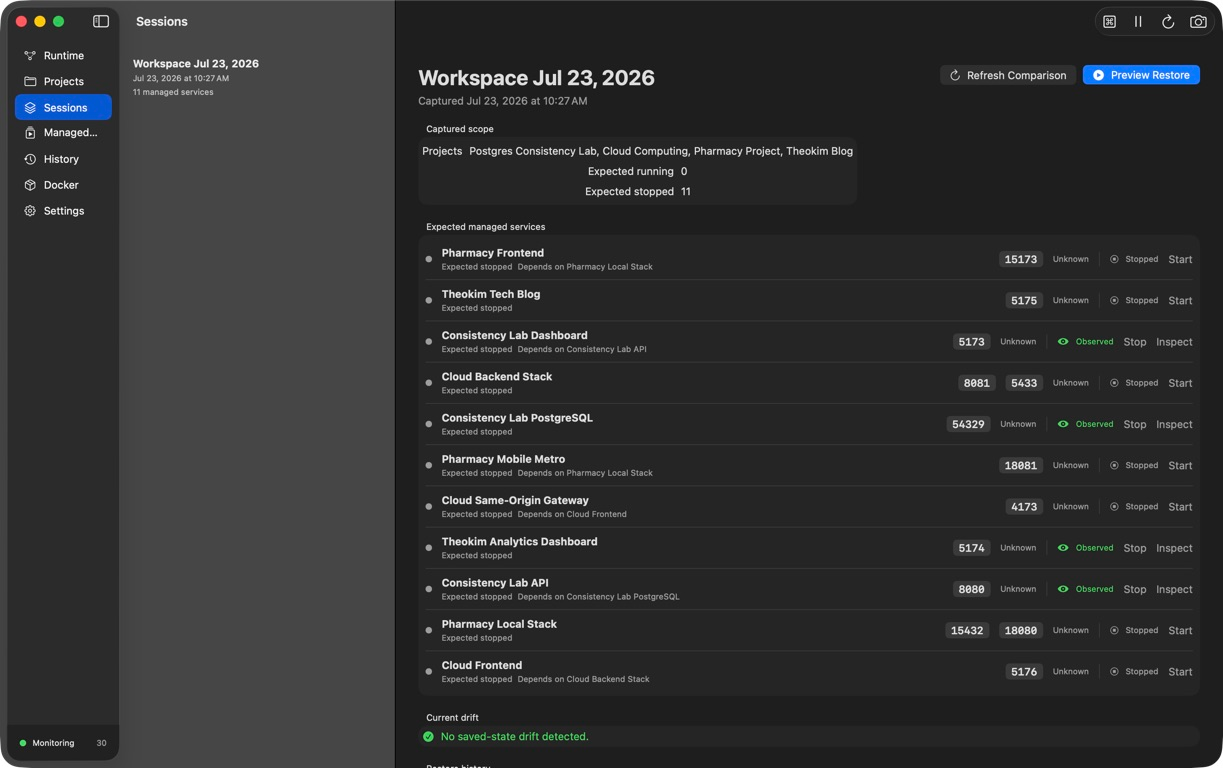
Opening a session compares that expected state with the current machine and shows drift. Restore always begins with a fresh preview, including when it is launched from the command palette. The preview checks that definitions still exist, Keychain references resolve, restart trust remains current, expected ports are available, dependencies are complete, directories and executables still exist, and no conflict has appeared.
The preview supports dry-run review, explicit confirmation of issues, expected-stopped handling, and optional rollback. Starts execute in dependency layers. If one layer fails, rollback can stop only the services started by that restore. It never stops an unmanaged process or a service that was already running as compensation. Restore history remains available so the result is inspectable after the workspace has changed again.
This is useful for work that spans more than one repository or mixes host and Docker services. Instead of remembering which five commands I ran yesterday, I can describe the state I want, compare it with today’s runtime, and review the difference before DevBerth changes anything.
Managed Services are the durable definitions behind reliable Start and Restart. A service can use a generic executable or command, npm, pnpm, Yarn, or Bun scripts, Gradle, Maven, an explicitly reviewed custom shell, a Docker container, or a verified Compose service. The definition records command boundaries rather than flattening everything into one shell string.
It also records the working directory, expected ports, readiness and health checks, shutdown behavior, restart policy, dependencies, log policy, and secret references. Supported checks include TCP, HTTP, reviewed command, file, Docker, and dependency conditions. DevBerth treats process-running, listener-open, service-ready, and service-healthy as separate facts; one does not automatically imply the next.
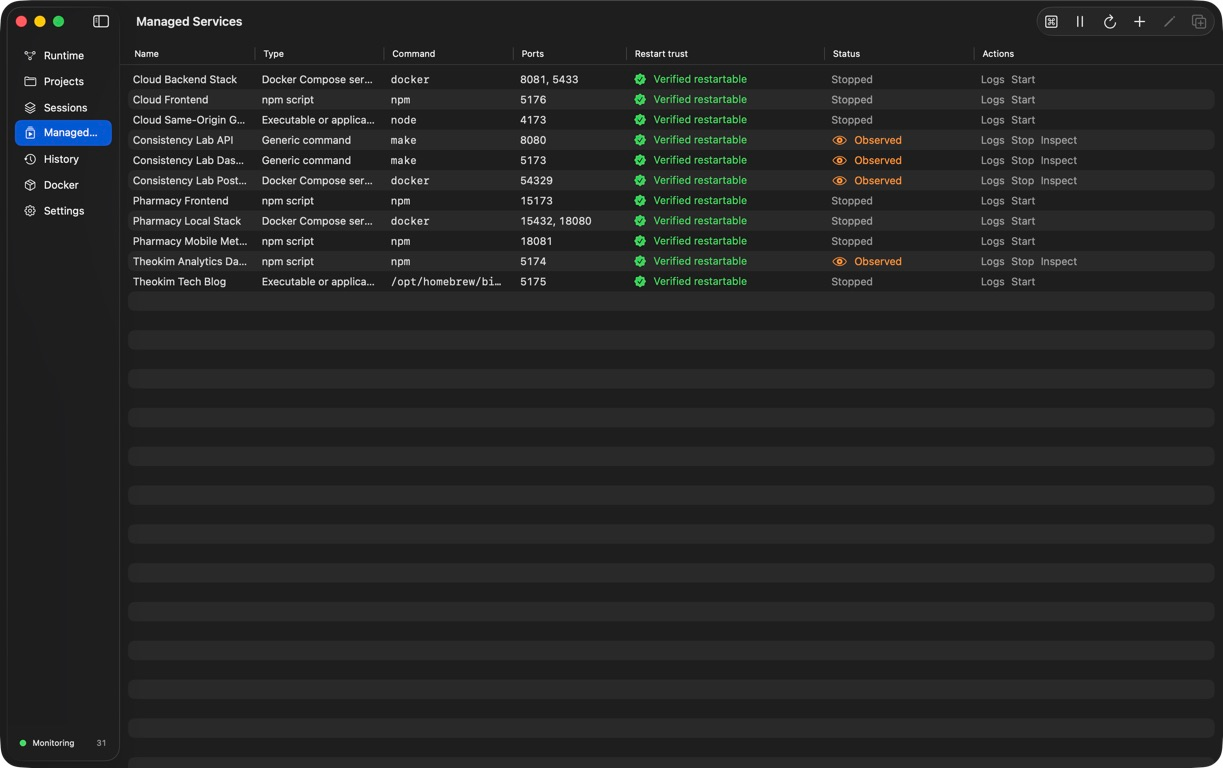
New and edited services are not automatically restartable. Validation launches the exact definition in isolation, observes expected ports and reviewed readiness checks, and performs a controlled stop. If the sequence succeeds, the exact configuration digest becomes Verified restartable.
Changing a safety-relevant field invalidates that trust. Editing the executable, arguments, working directory, expected ports, dependencies, checks, shutdown behavior, or secret references sends the service back to review. This can feel stricter than a typical process manager, but it keeps Start and Restart tied to the definition that was actually tested.
Each service row keeps its own operation state. Stopping one service does not make every other button look busy. Progress, success, refusal, and failure remain visible until a newer operation replaces them. The same row can open logs and the working directory, copy the reviewed command, inspect evidence, stop a current runtime, or start and restart when the exact trust state permits it.
Managed stdout and stderr are bounded in memory and on disk. Output passes through a streaming redactor before it reaches either place, including when a secret crosses chunk boundaries. Restart policies are attached to actual runtime instances and bounded by crash-loop limits rather than implemented as a UI toggle.
History answers “what changed while I was away?” It indexes bounded lifecycle evidence for filtering by time, severity, source, event type, service, summary, and result. The data includes launches, stops, exits, readiness transitions, health degradation and recovery, automatic-restart attempts, crash-loop limits, listener changes, Docker transitions, and session restore results.
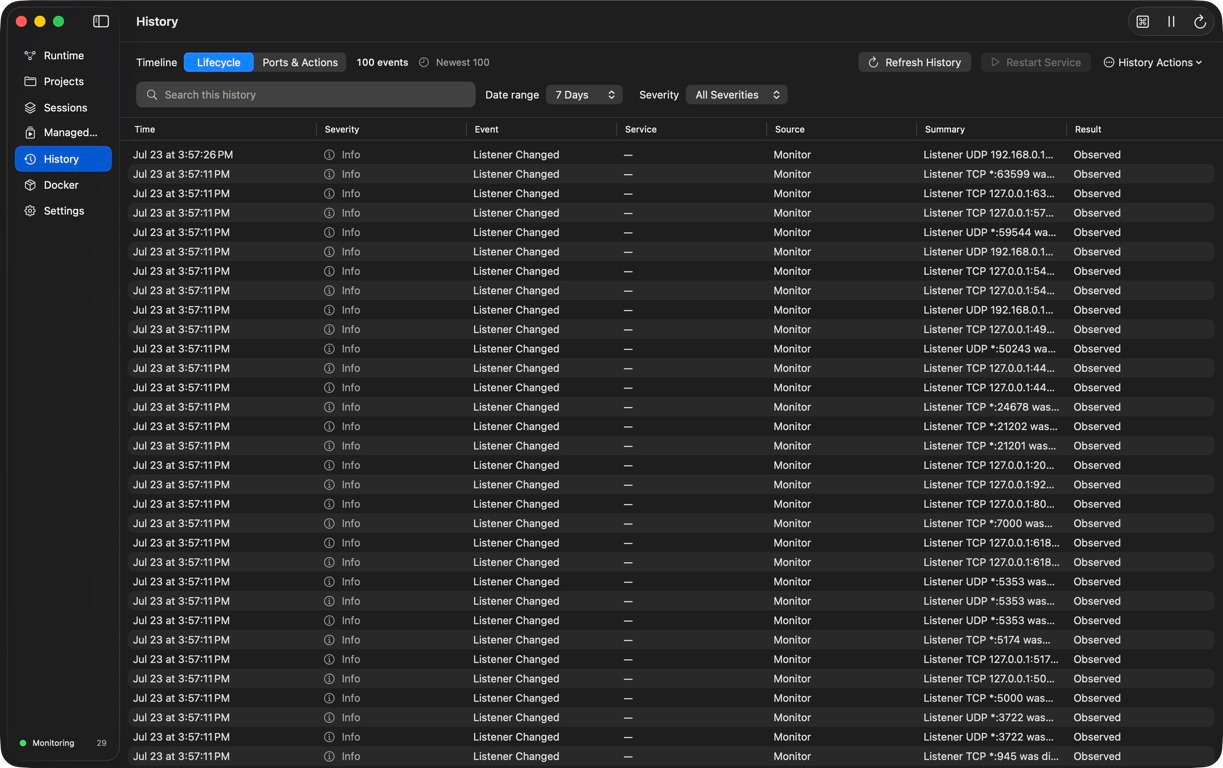
History keeps events factual. Incident summaries are deterministic and built from ordered evidence rather than generated prose. A partial project stop stays partial. A service that is running but not listening is not rewritten as healthy. Related runtime, service, project, and session identifiers make it possible to move from the summary back to the underlying evidence.
Retention is bounded and configurable. Logs, history exports, diagnostics, and audit details are already redacted and size-limited before they leave their original service. The goal is enough history to explain behavior without turning a local runtime manager into an unbounded data collector.
Docker is optional. Runtime monitoring still works when Docker is not installed or its daemon is stopped. When it is available, DevBerth reads structured container data, published ports, state, health, restart policy, recent logs, and canonical Compose labels.
Inspection can be broad, but mutation is intentionally narrow. A standalone container is addressed by its full current identity. A Compose mutation is available only after DevBerth verifies the exact project name, project directory, configuration and environment files, configuration hash, and current container membership. One-off containers never gain service-level authority, and DevBerth never falls back to signaling a container’s host PID.
If Docker becomes unavailable, the app reports that state and backs off its checks without taking host listener monitoring down with it. That separation matters on laptops where Docker Desktop is not always running.
Settings collects the safe configuration around the product. It exposes monitoring preferences, bounded history retention, appearance, permission guidance, the welcome guide, safe diagnostics, and the Codex/MCP integration. Full Disk Access opens the correct System Settings location rather than pretending the app can grant it.
Performance Diagnostics shows bounded aggregates such as current monitoring mode and interval, scan duration, coalescing counts, cache size and hit rate, Docker duration, and recent warnings. It excludes commands, paths, process details, environments, logs, and secrets. The sheet reads its snapshot only while it is open.
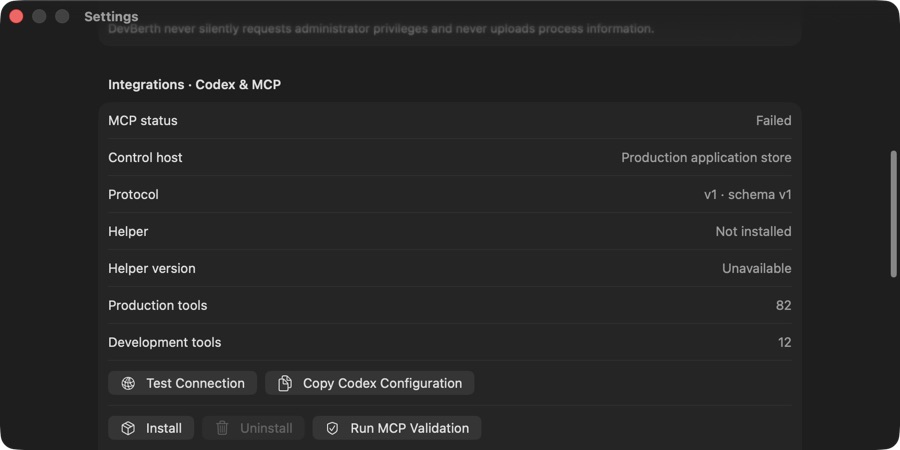
The Codex & MCP settings can install or repair the stable helper, preview a global or project Codex configuration change, test the connection, and run MCP validation. The editor preserves unrelated TOML, rejects duplicate DevBerth tables and symlinks, writes atomically, verifies the result, and keeps a timestamped backup.
The main window is not the only way to use these features. The menu bar shows counts for active managed services, unexpected listeners, and unhealthy services. It offers listener search, favorite service control, recent project Start and Stop, session capture, monitoring controls, and a route back to the main window.
Pressing ⌘K opens the command palette. It searches ports, PIDs, processes, commands, projects, managed services, and sessions. It can open every destination, refresh or toggle monitoring, start or stop projects, capture a session, open a restore preview, open or copy managed-service data, and start, stop, or restart a service. Restart appears only when the exact current digest is Verified restartable.
The menu bar and palette are shortcuts, not privileged surfaces. They call the same application actions as the main window and cannot bypass ownership, validation, confirmation, or restart-trust rules. Native labels, text alongside critical color states, keyboard navigation, accessibility descriptions, light and dark appearance, and localization-ready user strings are part of the same product surface.
One control plane, including Codex
All those features would be much less useful if each one invented a different definition of safety. DevBerth therefore has one monitor, one current runtime snapshot, and application-owned domain services for ownership, lifecycle, projects, sessions, persistence, and secrets. SwiftUI depends on service protocols; views do not call Process, lsof, ps, kill, Docker, or a shell directly.
The same boundary applies to Codex.
The easiest MCP implementation would have let a helper run its own discovery and shell commands. It also would have created a second runtime authority with its own cache, ownership logic, persistence, and failure modes. Instead, devberth-mcp is a thin STDIO adapter. It validates typed MCP input, communicates with the already-running app over a current-user Unix socket, and returns structured results.
Production currently exposes 82 tools plus resources and prompts for runtime inspection, ports, projects, services, dependencies, sessions, Docker, logs, history, settings, diagnostics, destructive previews, and coordinated change sets. The helper does not run its own lsof, ps, Docker, shell, database, or Keychain queries. The GUI and Codex are looking at the same snapshot and asking the same app services to act.
Production has no TCP control port. The socket lives under DevBerth’s Application Support directory with a private parent, restrictive file mode, matching-UID peer checks, bounded frames, deadlines, and protocol negotiation. Production and development use separate sockets and handshakes.
The identity of DevBerth itself is also checked. During development, a Debug control host and the installed Release app can share a display name and bundle identifier. Production activation therefore validates the exact /Applications/DevBerth.app, executable, Release marker, production socket, and persistence mode. Development activation requires an explicit app path and Debug marker. A familiar label is not strong identity, whether the target is a user process or DevBerth itself.
For host processes, a strong ProcessFingerprint combines PID, UID, executable path and file identity when available, start time, command digest, parent PID, and observation time. DevBerth also keeps the exact listener-to-process edge and resolves the lifecycle owner.
Immediately before a signal, it resolves the target again. A graceful stop waits for the configured timeout. Force escalation performs another fresh resolution instead of reusing the earlier decision. A changed fingerprint, listener edge, owner route, user, protected status, or controller context is a refusal.
observe
  → identify the process and listener
  → resolve the lifecycle owner
  → show the exact action preview
  → obtain confirmation
  → resolve and validate again
  → signal the exact scope
  → validate once more before force escalation
The rules differ by runtime state:
| Runtime state | Inspect | Stop | Start or Restart |
|---|---|---|---|
| Observed listener or process | Yes | Explicit confirmation plus fresh exact-owner revalidation | Observation grants no launch authority |
| Live DevBerth-managed runtime | Yes | Through its registered policy and revalidated process group | Only from the exact verified definition |
| Verified Docker or Compose owner | Yes | Through the verified controller context | Only while that exact context remains valid |
| Protected or unverifiable process | Limited evidence | Refused | Refused |
MCP destructive actions add a two-step authorization contract. operation_preview captures stable targets, revisions, process fingerprints, listener edges, owner routes, expected effects, risks, and compensation. The token expires after five minutes and can be used once. operation_execute consumes it only after resolving the current target again.
Five minutes is not a promise that the host will stay unchanged. It is only the maximum lifetime of the authorization. Changed revisions, replay, stale identity, different ownership, protected targets, or missing controller context still fail. Configuration batches use an equivalent change-set preview and execution flow, with compensation for already-applied configuration steps when a later step fails.
Secrets never cross this control boundary. SwiftData stores opaque Keychain references, not values. MCP can say whether a secret name is configured and currently resolvable, but it cannot retrieve the value or reference UUID. Profile edits stage Keychain changes and roll them back if validation or persistence fails. Duplicated services receive independent references rather than sharing secret lifecycle.
The local-only privacy model is equally important. DevBerth does not upload observed runtimes. Diagnostics omit commands, paths, environments, logs, and secrets. Manifests omit secret values and Keychain identifiers. Resource data and live process objects are transient. Tests use in-memory stores, no production socket, and static or application-owned fixtures; they do not enumerate or signal unrelated user processes or containers.
The current implementation covers the complete sidebar, menu bar, command palette, onboarding, service discovery, orchestration, sessions, lifecycle and health evidence, Docker and Compose routing, privacy controls, and MCP. The latest warnings-as-errors run passed all 216 tests across unit, persistence, harmless owned-process integration, UI, MCP, and application-identity coverage.
There are still limits. DevBerth cannot reconstruct an arbitrary process’s original shell session or complete environment. Root-owned and recognized system processes remain protected because there is no privilege-escalation helper. UDP does not have a universal TCP-style listening state. Project inference walks only bounded parents of a verified working directory instead of scanning the disk. The editor currently exposes one dependency selector even though the domain model supports larger graphs. Distribution remains source-first.
Those limits are intentional parts of the explanation, not details to hide after the feature list. DevBerth is useful because it connects a lot of local runtime information, but it is trustworthy only when it also says what it cannot prove.
What began as “what is using port 5173?” became a native runtime explorer, guarded service controller, workspace restorer, lifecycle record, Docker inspector, menu-bar tool, and MCP control plane. Every feature returns to the same initiative: understand the local workspace without guessing, and make control follow the evidence rather than the other way around.
The next article covers the performance problem that appeared after all of this was working. The monitor was collecting the right evidence, but it treated every refresh as meaningful change and used 69.2% CPU with the window closed.