On this page
I closed the window, but the work kept going
DevBerth is supposed to stay alive in the menu bar when its main window closes. What it was not supposed to do was keep a large part of one CPU core busy.
I noticed it in Activity Monitor. With the main window and menu popover closed, the Release build accumulated 623.86 CPU-seconds over 901 seconds: an average of 69.2% CPU. Nothing was visible and I was not interacting with the app.
My first guess was lsof. DevBerth does a lot of process discovery, so an expensive parser or classification pass seemed likely. Instruments told a more interesting story. The individual scans were not the whole problem; DevBerth was taking “nothing changed” and turning it into fresh UI and persistence work every two seconds.
Before changing anything, I fixed the comparison so I would not accidentally optimize one scenario and publish numbers from another.
| Item | Measurement condition |
|---|---|
| Machine | MacBook Pro Mac17,2, 10-core Apple M5, 24 GB |
| OS / toolchain | macOS 26.4, Xcode 26.4 |
| Runtime scale | Roughly 70 live host/Docker runtime rows, observed read-only |
| Build | Application and helper installed from the same Release build |
| Closed-window sample | Main window and menu popover closed for 901 seconds |
| Profiler | Approximately 30 seconds of the same idle scenario in Time Profiler |
| Safety | No unrelated process, service, or container was signaled |
The baseline commit was 8cc670e, and I recorded the optimized measurements on 2026-07-22. These are before-and-after numbers from one development Mac, not a benchmark for every Mac.
Activity Monitor was great for spotting the problem. To find it, I used Apple Instruments, os_signpost intervals, and small internal counters around discovery, enrichment, Docker, diffing, persistence, and SwiftUI publication.
The baseline Time Profiler trace made the hidden cost visible. The main thread spent 14.657 sampled seconds flushing SwiftUI run-loop observers and 13.566 seconds in AttributeGraph updates. The window was gone, but a retained graph was still being told that everything had changed.
The fix was to stop treating every refresh as news
The first bug was almost embarrassingly small. ObservedListener stored lastDetectedAt, and the process fingerprint stored detectedAt. Those timestamps changed on every scan, so ordinary value equality said the whole snapshot was new.
fixed two-second poll
  → fresh timestamps
  → whole snapshot unequal
  → SwiftUI publication
  → AttributeGraph update
  → lifecycle/history persistence
  → pruning and derived recomputation
I still needed the timestamps because evidence freshness matters. The fix was to separate fresh evidence from a meaningful runtime transition. A changed protocol, address, port, process identity, project, owner, Docker relationship, or managed-service relationship can be real news. A newer timestamp by itself is not.
That one distinction took deterministic unchanged-snapshot tests from 30 transactions and 3,460 persistent-history changes per minute to zero writes.
The next problem was cadence. Two seconds feels fine while I am looking at the Runtime screen. It makes no sense after the app has been hidden and stable for several minutes. The monitor now has one actor, one cancellable loop, and at most one scan in flight. Extra refresh requests coalesce instead of starting parallel work.
| Mode | Cadence | When it applies |
|---|---|---|
| Transition | 0.75 s | For 15 seconds after startup, wake, a real runtime change, or a known mutation |
| Active | configured 2 s | Main window or menu popover is actually visible in the foreground |
| Background | at least 10 s | No monitoring surface is visible |
| Idle | at least 30 s | Hidden with no semantic change for 180 seconds |
Getting “actually visible” right took more work than expected. SwiftUI’s onDisappear was not enough because AppKit backing windows could remain around after the surface closed. DevBerth now looks at real NSWindow visibility, occlusion, minimize and key-window state, plus whether the app is active or hidden. A menu-bar backing window only counts when the popover is truly active.
Then I reduced all the little child processes that had been multiplying each other. Process enrichment is cached only when a full native identity matches: PID, UID, start time, parent PID, executable path and file identity, argument digest, and working directory. The cache can save discovery work, but it can never authorize Stop or Restart; control still does a fresh identity and ownership check.
Resource usage moved to one batched ps with slower 1/5/30/60-second schedules as the surface moves from transition to idle. Docker uses one list and one batched inspect, a short success cache, and backoff when unavailable. Health checks have bounded concurrency. Logs drain continuously but only update the visible model in small batches when their revision changes.
In a 141-second idle observation, the monitor created nine direct children, or 3.8 per minute. The deterministic pre-metadata baseline was at least 126 per minute, so the rate fell by about 97%. Very short ps calls can slip between 200 ms samples, which is why I call that result a lower bound rather than zero work.
One last surprise came from UDP. High-numbered, interface-bound UDP endpoints appeared and disappeared often enough to keep resetting the fast transition cadence. DevBerth still observes them, but while hidden it no longer treats that narrow kind of churn as a reason to poll at 0.75 seconds. TCP, lower UDP ports, and wildcard or loopback UDP changes still speed the monitor up immediately.
Finally, SwiftUI publication became surface-aware. AppModel always keeps the newest snapshot, but while hidden it does not wake SwiftUI for timestamp-only or resource-only refreshes. In the foreground it publishes meaningful listener changes, CPU moves of at least one percentage point, or memory moves above the larger of 1 MiB and 5%. When the first monitoring surface comes back, the newest hidden snapshot is published once.
The result, and the parts I did not hide
The matched Release comparison looked like this:
| Metric | Baseline Release | Optimized Release | Change |
|---|---|---|---|
| Closed-window CPU | 623.86 CPU-s / 901 s = 69.2% | 1.06 CPU-s / 901 s = 0.118% | 99.83% less |
| Time Profiler CPU | 24.4 CPU-s / ~30 s | 0.027 CPU-s / 30.742 s | 99.89% less |
| Main-thread sampled CPU | 19.558 CPU-s | 0.001 CPU-s | 99.995% less |
| Direct monitoring children | at least 126/min | 9 / 141 s = 3.8/min | about 97.0% fewer |
| Main-window foreground CPU | 34.17 / 69 s = 49.5% | 1.57 / 60 s = 2.62% | 94.7% less |
The final idle Time Profiler trace contained 27 samples and 0.027 CPU-seconds over 30.742 seconds. The main thread had one 0.001-second sample, with no potential hang above 250 ms. The idle SwiftUI trace also reported no hitch or hang.
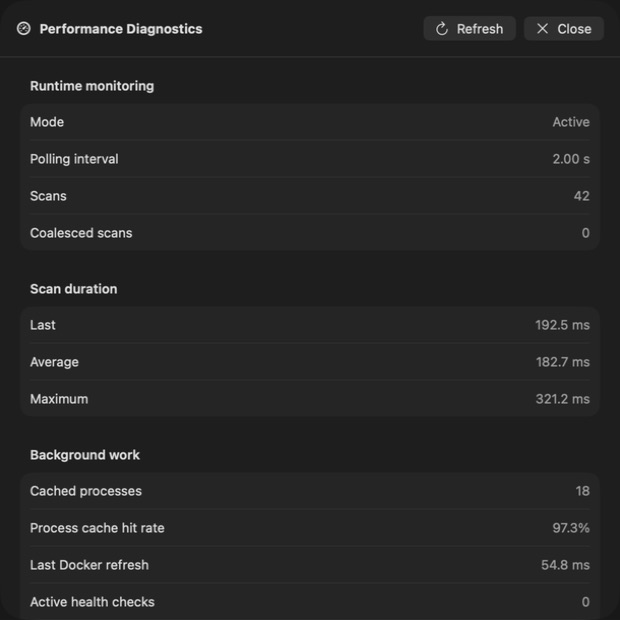
The diagnostics screenshot is a live snapshot, not the source of the benchmark. It shows cadence, scan duration, cache hit rate, and enrichment totals without exposing commands, paths, environments, logs, or secrets. It only polls while the sheet is open.
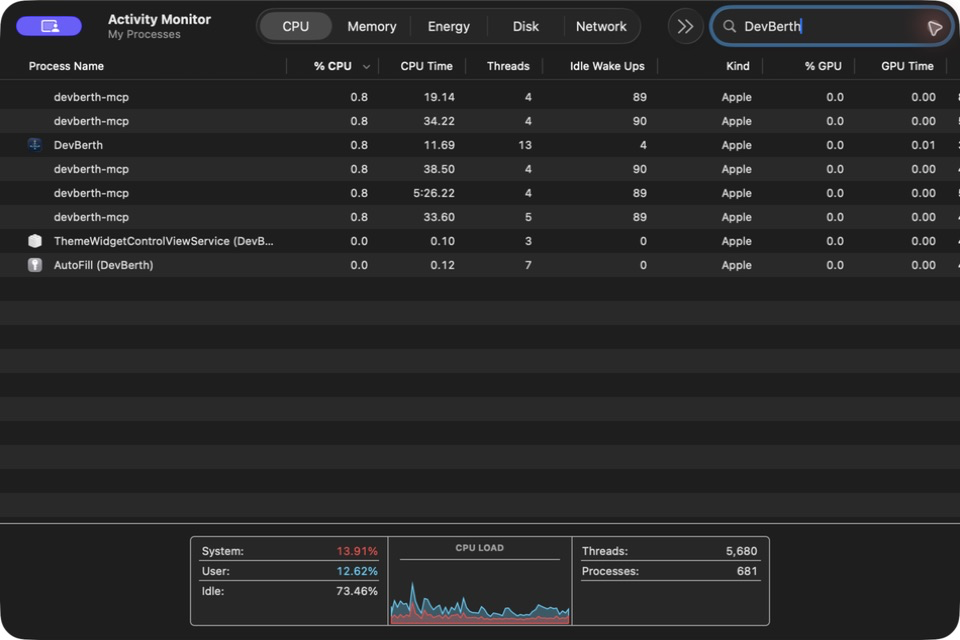
The Activity Monitor image is also just a spot check. Several devberth-mcp rows can belong to different active Codex clients, so I did not add them together and compare that total with the single-app closed-window sample.
I also kept a repeatable five-minute soak test. run_performance_soak.sh launches an isolated Release app with in-memory persistence, fixed listener and resource fixtures, unavailable test Docker, and no production socket. It samples and terminates only the PID it launched.
In the final 300-second run, CPU time rose by 0.11 seconds over the 293 seconds after startup, or about 0.038%. RSS settled between 132,992 and 165,568 KiB and ended at 133,040 KiB. Threads settled from 11 to five or six. Every sample saw zero direct children, and the application log contained no error, fatal, or crash lines. The warnings-as-errors run passed all 210 tests at the time, and the broader soak gate passed twice.
Not every loose end disappeared. The old timestamp bug had already left roughly 118 MB of persistent-history backlog in the production store. The optimized sample stopped that false growth, but I did not quietly vacuum or destructively compact existing user data as part of a CPU fix.
I also did not invent measurements I could not get. Command-line Instruments did not expose Power Profiler on macOS 26.4. System Trace export never produced a usable artifact. There was no untouched-baseline kernel wakeup count, so there is no wakeup-reduction percentage here. leaks -quiet found three 80-byte CGRegion allocations, 240 bytes total, but no growing app-owned signature; that is not the same as claiming zero leaks.
Polling still exists because the macOS 14 deployment baseline has no public event API that fully reports TCP and UDP listener ownership. Hidden evidence can be up to 30 seconds old, and a brief high-numbered interface UDP endpoint can disappear between scans. Foreground navigation also still produced two potential hangs at 279.19 and 319.81 ms. Those hitches are another profiling job, not something I wanted to bury under a good idle number.
The biggest improvement was not a clever parser or a faster poll. It was teaching the app that a newer observation is not always a new event. DevBerth is built to notice runtime changes, and the best performance work was finally giving it a good way to say, “nothing happened.”